LINKÖPING
Simulating Automated Mobility
1 Scope
The Linköping twin Mega pilot evaluates the use of autonomous shuttles for public transport. The major point of interest was the operation of the shuttles within shared space areas, forbidden for usual traffic, yet used by pedestrians, bicyclists, and the shuttles simultaneously.
As such, the main topic of work for the simulation part was to develop, implement, test, and evaluate new algorithms for replicating shared spaces.
1.1 Pilot description
The main demo-site in Linköping is in the campus area, shown in Figure 1. Within this area, one can find the university, 370 companies, schools, daycare centres and residential houses. The demonstration track covers normal roads and a shared space section, where automated buses, pedestrians and bikes can share the space together. In the beginning, two out of three shuttles were running clockwise in the campus area with 8 bus stops and the service period is from 8 to 18 on weekdays and from 10 to 17 on weekends.
The planned demonstration services are to improve user experience for all users and to provide a robust first/last mile solution to public transportation.
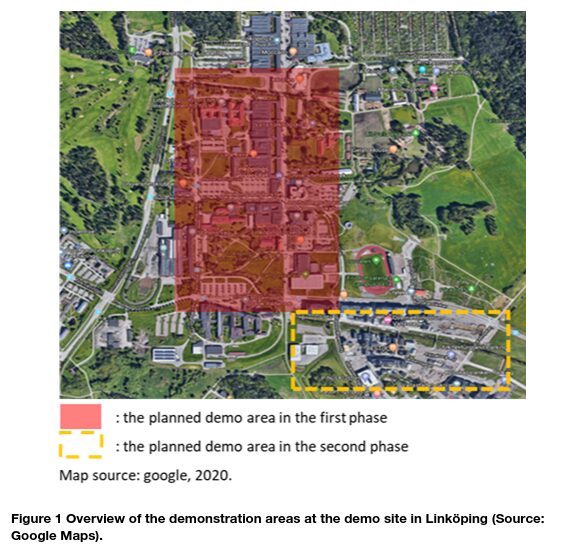
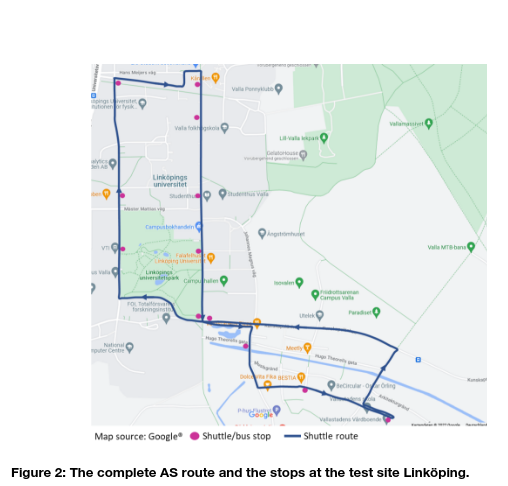
The test site Linköping has extended its AS service from the campus to the neighboring residential area named Vallastaden, indicated by the orange dash line Figure 1, as planned since the middle of 2022. The main purpose for the extension is to improve the elderly’s and children’s travel qualities, accessibility and experiences. Apart from the 8 stops on the campus, there are now totally 12 stops on the whole AS route (around 4 km long), illustrated in Figure 2. Currently, 3 AS, one Navya DL4 and 2 EasyMile EZ10 Gen2, are in operation and the maximum speed remains 13 km/h due to the legal regulation, while the general road speed limit varies between 30-40 km/h. In addition, a local dashboard, based on the SAFE platform, that is developed by the Saab Group, is continuously under implementation to support the preparation toward vehicle remote monitoring and tele-operation, executed by a traffic management center (TMC). The orders issued by TMC will be carried out by safety operator onboard.
1.2 Simulation Network
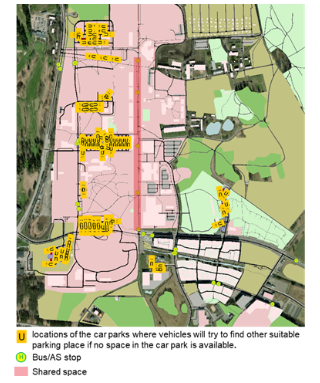
The adapted simulation network with the consideration of the extended AS route, the relevant car parks and local bus stops are shown in Figure 3. The edges in the shared space are adjusted to bidi-edges for enabling road users to interact with each other regardless of running direction. In addition, shuttle and local buses shared the bus lanes in the extension area (Vallastaden).
The OSM-based simulation network for the campus area was set up with network correction in the beginning. In order to better understand how AS operate and what kind of issues they have faced, the respective trajectory data was collected and analyzed.
Afterward, the simulation network has been extended due to the change in AS’s service area. Parking traffic and local public transport are considered in the simulation as well. Video data in the shared space and flow data within the test site were collected and evaluated for adapting simulation environment and the relevant parameters.
1.3 Simulation parameters
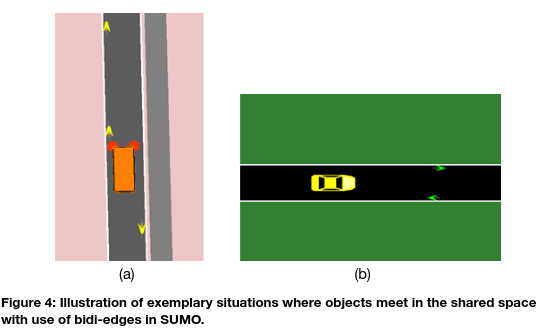
SUMO has been continuously enhanced with the main focus on overtaking behavior, made by bikes, and road users’ interactions in shared space. Road users in a shared space interact with each other when they are approaching each other also when they are in opposite direction. Such situation is normally not considered in traffic simulation, which commonly only considers unidirectional roads/traffic, i.e. road users do not take other road users in the opposite direction into consideration. To simulate such interactions, the concept of bi-directional edges in SUMO, used for railway simulation, was adopted and extended, so that simulated pedestrians, vehicles and bicycles on bidi-edges can interact with each other in both directions. A bidi-edge is modelled by two edges that have their geometries exactly reversed so that lane geometries are overlaid exactly. Objects on such edges can, if necessary, adapt their behavior when approaching each other. An example is illustrated in Figure 4.
Speed deviation, maximum acceleration and deceleration and maximum speed were adjusted for passenger cars, pedestrians, bicycles and AS to data collected at the test site using the installed cameras. Furthermore, the parameters related to vehicles’ and bikes’ overtaking possibility are adapted so that bikes do not actively tend to make overtaking, and could make overtaking on the right-hand side, observed in the real situation. The sub-lane model in SUMO is remained to be used and the simulation runs with a simulation step length of 0.1 seconds.
1.4 Simulation scenarios
The scenarios considered here are to provide an insight into the extended simulation environment and possible AS’s influences on the network performance. There is a well-built walking path infrastructure, separated from the vehicular roads, at the test site and pedestrians mainly use the sidewalks in the shared space. Thus, the analysis made here is with the focus on vehicles, bicycles and local buses.
The scenarios focus on a general situation when there are vehicles leaving the parking lots. The total simulation duration is 2 hours, where the first hour is for the warming-up purpose, so that the simulation does not begin with an empty network and there are already vehicles in the parking lots. The considered demand includes 532 vehicles (96 buses, 66 cars, 381 cars leaving from parking lots), 330 pedestrians and 394 bicycles. AS run every 20 minutes and local buses lines operate with an average period of 15 minutes.
2 Tools
“Simulation of Urban MObility” (Eclipse SUMO) is chosen for carrying out the simulation work. SUMO is an open source, highly portable, microscopic and continuous road traffic simulation package designed to handle large and complex road networks. It allows for intermodal simulation including pedestrians and comes with a large set of tools for scenario creation. Moreover, the SUMO community is active and getting larger since the first public release, done twenty years ago. The development results in SUMO can be further used by public and related synergies are highly expected due to its open-source nature.
The main simulation focus is put on the campus area, especially on the shared space area, where the main road users are cyclists, the demonstrated automated shuttles and pedestrians. The aims are (1) to get a better understanding on the possible impacts on introducing automated shuttles on bicycle infrastructure; and (2) to investigate if current available traffic simulation approaches can be used to simulate interactions between bikes and automated shuttles on a double-directed and non-divided bike path. To achieve the aims mentioned above the necessary features/functions will be defined and implemented in SUMO according to the demo site character. Some pedestrian-related effects will also be considered for reflecting the general behaviours which happen usually in a shared space area.
3 Key Inputs and Outputs
3.1 Data used
The Shuttles at the test site Linköping have been running on the campus for testing and verification purposes since the end of 2019. Some trajectory data has been collected during the testing period. According to the collected shuttle trajectory data (from 01.09.2020 to 07.11.2020), the car-following models in SUMO were examined. The selected model was further calibrated and validated accordingly.
To understand the traffic situation, traffic composition and enhance the simulation modelling and the parameter setting two Telraam devices were further installed at the main road and in the shared space in the period between the 22nd of September to the middle of December 2021 for collecting flow and speed data respectively. Moreover, a Viscando OTUS3D video camera system was installed at the place where the Telraam device was located, in the shared space from the 20th of September to the 26th of September for capturing the interactions between AS, bicycles, and pedestrians. Since all devices use cameras to detect/count objects, measurement errors are expected due to weather conditions, situations where objects are hidden by AS, and wrong classification, e.g., due to two objects being close to each other. Nevertheless, this data can help to find out the peak hour, the rough amount of the involved traffic participants and potential critical conflicts/issues.
3.2 Extracted KPIs
With the consideration of the available data for simulation, the available KPIs include average speed per vehicle type, vehicle stops, hard braking events between vehicles, total intersection delay when the definition is given, total network travel time per vehicle type, total travelled mileage per transport mode, total network delay, average network speed, and number of trips per transport mode.
4 Followed Models
The control logic of automated shuttles at the test site Linköping belongs to trade and business secrets and cannot be obtained. Therefore, the applicability of the current models in SUMO are examined in AP10.2, and the result is reported in D10.2, D10.3 and Gugsa Gebrehiwot (2021). Following the analysis result, The Intelligent Driver Model (IDM-Model), proposed by Martin Treiber (Treiber et al. 2000), is used. The automated shuttles, deployed at the test site Linköping, follow the pre-defined virtual rail track, and are not allowed to do any lane-changing manoeuvres. So, the shuttles are set to run on the rightmost side on roads and the sublane model (Erdmann (2015) and Semrau & Erdmann et.al. (2016)) in SUMO is used to reflect situations that some other road users, especially cyclists and pedestrians, may share the lane space with automated shuttles, overtake or yield the automated shuttles running close to them. More information about the models can be found in SUMO (2023).
5 Results
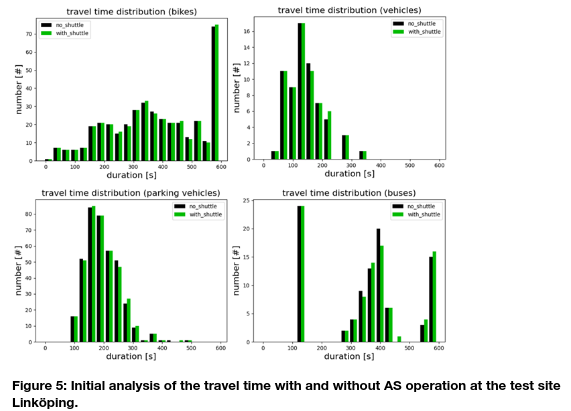
The simulation work is still on-going. This part will be revised later once the simulation work is done. As an example, Figure 5 shows different road users’ travel time comparison before and after the AS operation at the whole network level. Although the given traffic demand is not high and the AS only run every twenty minutes, differences in travel time for each road user type can be revealed. The main reason for that is due to AS’s low travelling speed. When bikes, buses and vehicles happen to run behind AS, the respective travel duration will then increase.
6 Strengths and Limitations
The simulation work is on-going currently. This part will be revised later. The test site is on the campus of the Linköping University, a small part of the city, and the available data for the simulation work is limited, especially traffic demand and mobility patterns. Thus, this simulation work is more suitable for scenario analysis for decision support and finding out critical issues, e. g. the changes in the traveling speeds of AS, the AS fleet size and the operation schedule.
7 Conclusions
The simulation work is on-going currently. The present result shows that AS may slow down the traffic due to its allowed low travelling speed. When bikes, buses and vehicles happen to run behind AS, the respective travel duration will then increase. Such a situation will affect the overall network performance under higher traffic load conditions, since most of the roads at the test site have only one lane per direction.
References
SUMO (2023). SUMO online documentation, https://sumo.dlr.de/docs/index.html.
Treiber, T.; Hennecke; A. & Helbing, D. (2000). Congested traffic states in empirical observations and microscopic simulations. Physical review. E, 62, pp. 1805–1824. http://dx.doi.org/10.1103/PhysRevE.62.1805
Gugsa Gebrehiwot, R. (2021). Traffic Simulation of Automated Shuttles in Linköping University Campus, Master thesis, Department of Science and Technology of Linköping University, Sweden. https://www.diva-portal.org/smash/get/diva2:1582495/FULLTEXT01.pdf
Erdmann, J. (2015). SUMO’s Lane-changing model. Lecture notes in control and information sciences, 13, pp. Springer. pp.105-123. https://doi,org/10.1007/978-3-319-15024-6_7. ISBN 978-331915023-9
Semrau, M. & Erdmann, J. (2016). Simulation framework for testing ADAS in Chinese traffic situations. SUMO User Conference 2016 – Traffic, Mobility, and Logistics, 30, pp. 103-115. ISSN 1866-721X.