MONHEIM AM REIN
Simulating Automated Mobility
1 Scope
The test site Monheim am Rhein (Monheim) at the German mega pilot evaluates the use of automated shuttles for public transport. The major point of interest was the operation of the shuttles, integrated in the local regular public transport system, in the old town and within shared space area. In the latter one, there are mainly only cyclists, pedestrians and automated shuttles.
1.1 Pilot description
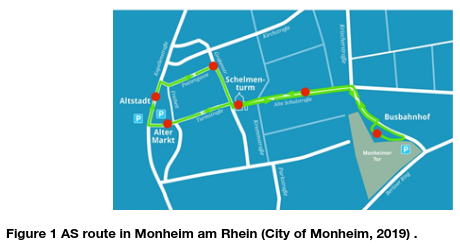
The city Monheim has officially joined the project SHOW as test site since the beginning of 2023. There have been automated shuttles in Monheim since the beginning of 2020, and 5 EasyMile AS (EZ10 Gen2 with SAE level 4) are in service. Due to the current regulation a safety driver is on board. The whole AS operation, i.e. Line A01, is fully integrated into the regular public transport service and provide service between the bus terminal and the old town at 15-minute intervals from 7 a.m. to 11 p.m. everyday. The originally planned shuttle route, shown in Figure 1 is used since the end of 2022. Currently, the AS operate on the pre-defined detour route with a maximum speed of 20 km/h and stop at 6 pre-defined places. The shuttle route is around 2.7 km long.
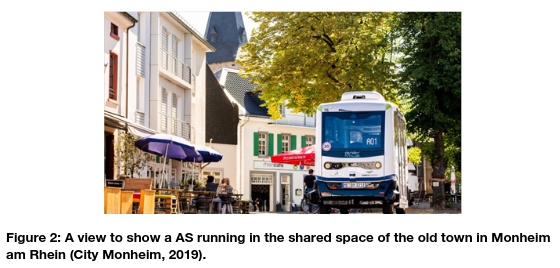
Moreover, just like a typical old town, the road infrastructure in the old town area is quite compact and includes a shared area where bikes and pedestrians are the main users and that can be also used by delivery vehicles occasionally. Most streets have only one lane. The AS route consists of one-way streets, two-way streets and shared space. In the latter area, AS have more interactions with bikes and pedestrians. Figure 2 gives an idea about the AS running in the shared space. In addition, AS run to and leave from the bus terminal. The respective intersections between AS and buses are expected during operation.
1.2 Simulation Network
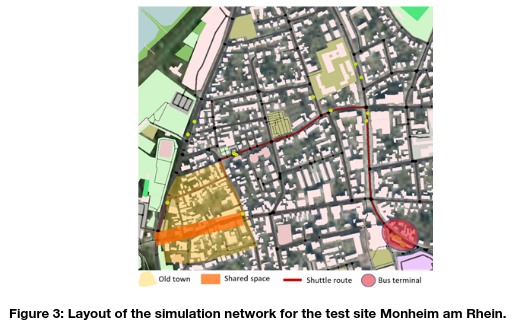
The network is based on OSM and generated with use of SUMO’s tool osmWebWizard.py. The respective public transport data in OSM is also imported and the related bus routes and stops are considered in the simulation. Bus flows were generated synthetically. The implemented bi-directional edges for modelling the interactions between road users on both directions are used for setting up the shared space in the simulation. Figure 3 gives an overview about the network layout and the shuttle route.
1.3 Simulation parameters
Currently, no vehicular data is available from the test site yet. Regarding missing vehicular trajectory data and the relative high site similarity related to deployed shuttles and road usages, the corresponding results from the test Linköping are applied in the simulation here. The test site Linköping also adopts EZ10 Gen2 and the respective trajectory data was used for calibrating the simulated shuttle parameters. The other parameters related to bikes and pedestrians will also be corresponding to those used in the simulation of the test site Linköping. Only the bike parameters related to the distance to be hold from intersection are adjusted due to the site character (not campus area). Such parameter consistence can facilitate the analysis work in case of that cross comparison will be executed between test sites Linköping and Monheim am Rhein.
1.4 Simulation scenarios
With the aim to help to identify critical issues with regard to the research questions, pointed out in D9.3, and to shape the corresponding analyses the aspects related to vehicles, parking lots, bicycles, pedestrians and local buses are considered in the simulation environment. To provide an overview about the built simulation environment, two scenarios, with and without AS operation respectively, are established. The local bus lines and the AS run every 15 minutes. The simulation period is set to 1 hour and the considered traffic demand include 590 vehicles, 253 people, 175 bicycles, 104 buses.
2 Tools
“Simulation of Urban MObility” (Eclipse SUMO) is chosen for carrying out the simulation work. SUMO is an open source, highly portable, microscopic and continuous road traffic simulation package designed to handle large and complex road networks. It allows for intermodal simulation including pedestrians and comes with a large set of tools for scenario creation. Moreover, the SUMO community is active and getting larger since the twenty years. The development results in SUMO can be further used by public and related synergies are highly expected due to its open-source nature.
As mentioned above, the main simulation focus is put on the shared area, where the main road users are cyclists, the demonstrated automated shuttles and pedestrians, and the bus terminal area, where busses need to interact with automated shuttles. Accordingly, the aims are to (1) get a better understanding on the possible impacts on introducing automated shuttles in the shared space and the bus terminal area; and (2) to investigate if current available traffic simulation approaches can be used to simulate interactions between road users and automated shuttles in the abovementioned areas. In order to achieve the above-mentioned aims the necessary features/functions will be defined and implemented in SUMO. Some pedestrian-related effects will also be considered for reflecting the general behaviours which happen usually in a shared space area.
3 Key Inputs and Outputs
3.1 Data used
As mentioned above no data is available currently. Therefore, the simulation work is based on the data from the test site Linköping.
3.2 Extracted KPIs
This part will be added later when it is clear which KPIs are needed for impact assessment. With the consideration of the available data for simulation, the available KPIs include average speed per vehicle type, vehicle stops, hard braking events between vehicles, total intersection delay with a given definition, total network travel time per vehicle type, total travelled mileage per transport mode, total network delay, average network speed, number of trips per transport mode.
4 Followed Models
The control logic of automated shuttles at the test site Monheim belongs to trade and business secrets and cannot be obtained. According to the model examination work done for the test site Linköping and the relative high site similarity with the test site Linköping, the models used here correspond to those applied for the test site Linköping. The Intelligent Driver Model (IDM-Model), proposed by Martin Treiber (Treiber et al. 2000), is used. The automated shuttles, deployed at the test site Monheim, follow the pre-defined virtual rail track, and are not allowed to do any lane-changing manoeuvres. So, the shuttles are set to run on the rightmost side on roads and the sublane model (Erdmann (2015) and Semrau & Erdmann et.al. (2016)) in SUMO is used to reflect situations that some other road users, especially cyclists and pedestrians, may share the lane space with automated shuttles, overtake or yield the automated shuttles running close to them. More information about the models can be found in SUMO (2023).
5 Results
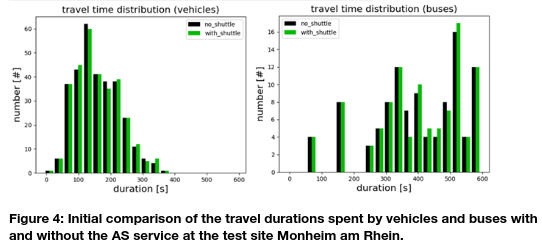
The simulation work is still on-going. This part will be revised later once the simulation work is done. As an example, Figure 1 shows the initial simulation result that AS has certain impact on the overall network performance and road users’ travel time, especially due to the lower allowed maximum speed and the limitation of road infrastructure, i.e. most roads have only one lane.
6 Strengths and Limitations
The simulation work is on-going currently. This part will be revised later. The test site is at the old town area, small part of the city, and the available data for the simulation work is very limited, especially traffic demand, surrounding traffic and mobility pattern. Thus, this simulation work is more suitable for scenario analysis for decision support and finding out critical issues, e. g. the changes in the traveling speeds of AS, the AS fleet size and the operation schedule.
7 Conclusions
The simulation work is on-going currently. This part will be revised later. The present result shows that AS may slow down the traffic due to its allowed low travelling speed. When buses and vehicles happen to run behind AS, the respective travel duration will then increase, since the test site is in the old town area and most of the roads have only one lane per direction. Since the AS also stop at the bus terminal, its low running speed may also affect the bus operation at the bus terminal, especially during the peak-hour periods.
References
City Monheim (2019). https://www.monheim.de/stadtleben-aktuelles/news/nachrichten/autonomer-bus-start-fuer-die-vermessung-der-strecke-7131, accessed on 09.09.2022
SUMO (2023). SUMO online documentation, https://sumo.dlr.de/docs/index.html.
Treiber, T.; Hennecke; A. & Helbing, D. (2000). Congested traffic states in empirical observations and microscopic simulations. Physical review. E, 62, pp. 1805–1824. http://dx.doi.org/10.1103/PhysRevE.62.1805
Erdmann, J. (2015). SUMO’s Lane-changing model. Lecture notes in control and information sciences, 13, pp. Springer. pp.105-123. https://doi,org/10.1007/978-3-319-15024-6_7. ISBN 978-331915023-9
Semrau, M. & Erdmann, J. (2016). Simulation framework for testing ADAS in Chinese traffic situations. SUMO User Conference 2016 – Traffic, Mobility, and Logistics, 30, pp. 103-115. ISSN 1866-721X.