KLAGENFURT – CARINTHIA
Simulating Automated Mobility
1 Scope
One of the sites of the Austrian Triple Mega site the Klagenfurt mega site aims to connect the respective train station of Klagenfurt to the local neighbourhood. In Klagenfurt, the train station is connected to the university, a business and science park and a living area.
1.1 Pilot description
Within the area of Seaside Park, Europapark and Alpen-Adria university located at the western border of the City of Klagenfurt (Carinthia) a shuttle service operated by SURAAA with three Navya Shuttle will be established. The pilot will operate three lines with three shuttles in total. The simulations’ goal is to pre-identify the impacts on common road traffic within the planned shuttle routes. The results show that the automated shuttles have no significant impact on regular traffic. Hence, no improvements of the routes and the physical environment need to be taken to accommodate the automated shuttles.
1.2 Simulation Network
AIT generated a mesoscopic approach with the mesoscopic package implemented in SUMO for laying a foundation in terms of traffic assignments towards large-to-small modelling tools. With this package, a complete microscopic network including person plans could be generated in a single step. After execution, the following network was available.
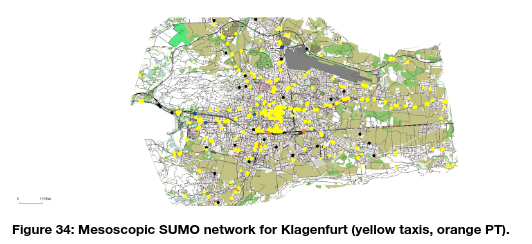
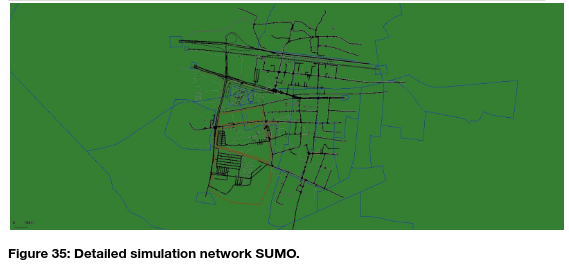
A mesoscopic simulation sized as shown above is not feasible for a detailed pilot-study, as the impacts are locally expectable, and a more practicable computing time was also a target. The network itself was resized to provide a simulation interface to all planned routes within the pilot at Klagenfurt, as show in Figure 35.
1.3 Simulation parameters
The shuttle itself was implemented as already used within two projects, namely auto.bus seestadt and Drive2theFuture, where AIT contributed microscopic simulations and pilot support to the overall project results. No ODD-breakdown is simulated, the setup of the shuttle(s) were not altered during each simulation run and were not changed throughout each scenario.
- Table 10: Navya shuttle SUMO vehicle model values Klagenfurt pilot.
| Shuttle name | Max. speed [m/s] | sigma | Tau | acceleration [m/s] | deceleration [m/s] | Actionsteplength [s] | vClass | carFollowModel |
| Navya_neu | 13.8 | 0.6 | 1.0 | 1.2 | 5 | 0.1 | evehicle | ACC |
1.4 Simulation scenarios
The simulation consists of five scenarios in total, as shown in the list below. The shuttle is operated with a scheduled cycle time accordingly to the length of the route. The main advantage of this approach is that the vehicle is kept in the simulation, so delays are simulated in a better and more precise way. Using a standard public transport vehicle operated under a schedule means, that the used shuttle would be terminated at the end of its scheduled journey along each planned route and a new shuttle will be placed on the starting point of the route within the next scheduled round-trip. Statistics covering complete operational phases, such as overall-travel time or overall-stops, are not possible.
Scenario B – Baseline Scenario
This scenario specifies the baseline situation with demand generated from 2019 demographic data and calibrated with traffic count data acquired from macroscopic transport models and counting data from traffic light signals. Also the baseline public transport service is integrated and used in the simulation.
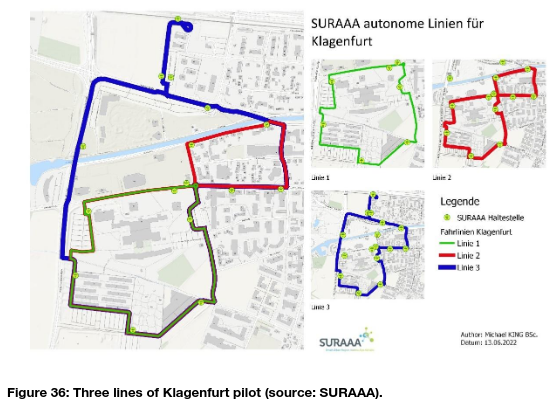
Scenario 1 – Baseline Scenario + Route 1 SURAAA
Describes the simulation of the route in light green, shown in Figure 36, connecting the university of Klagenfurt (AAU) with parking lots in the south-western part of the demo area. This route is 4000 meters long and consists of seven stops in total.
Scenario 2 – Baseline Scenario + Route 2 SURAAA
The baseline traffic is added to the simulation of route 2, shown in red. This route, eight-shaped, connects bus lines on the main road between the train station and the demo area. Within this route, also route 2 is embedded.
Scenario 3 – Baseline Scenario + Route 3 SURAAA
Within R3, the train station near Minimundus, a well-known touristic venue, is equipped with automated shuttle transport, additionally to the local public transport service. This route shares parts with both other routes, but is more planned as an outer ring-route to connect each bus- and train-service feeding the demo area.
Scenario 4– Baseline Scenario + Route1 + Route 2 + Route 3
This simulation approach allows to identify impacts if all three routes are operated at the same time during a normal workday.
2 Tools
The simulation is utilized with the open-source traffic simulator SUMO. On top of the simulator, a demand generation algorithm, based on the common four-step- demand generation model is placed. This model is used to provide realistic, demographic data-based movements within the transportation network.
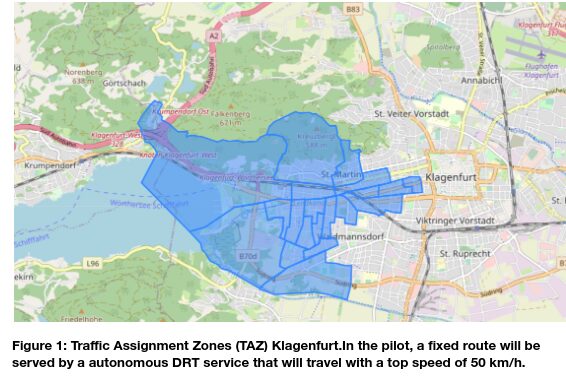
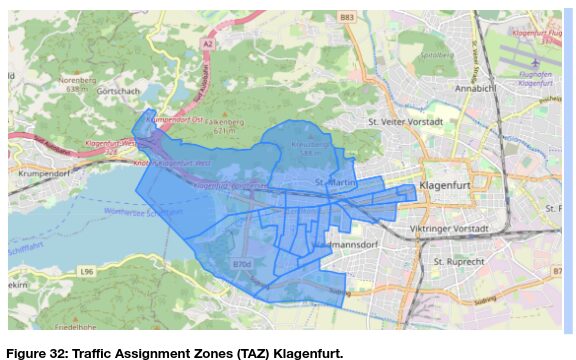
As foundation, traffic assignment zones (TAZ), as shown in Figure 32 are used to match official demographic datasets for calculations within the four-step model and connect demand to the microscopic simulation network.
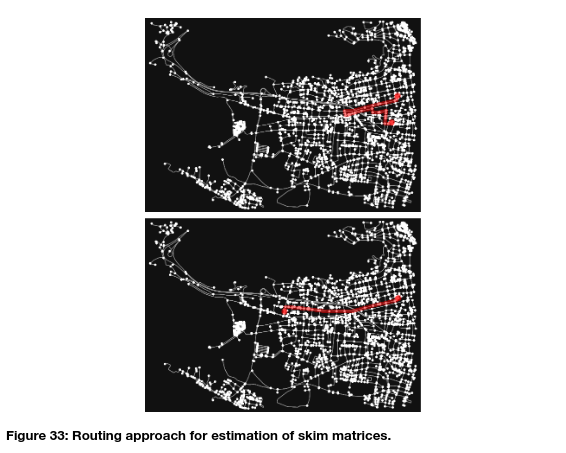
The four step model relates not only on demographic data, but also on data of land use coverage. In this model specific demand generation values for each demand generating entity are used, that can be found in each TAZ. With this approach each TAZ generates a specific amount of demand. To define certain demand streams between TAZ, a skim matrix based approach is used to identify boundaries between TAZ in terms of travel distance and travel time. Figure 33 shows the generation of these skim matrices based on routing between five points in each TAZ to all other TAZ.
The final step is to generate a transport mode specific matrix for each TAZ-relation and based on the routing results. With this demand TAZ-relations are routed within the microscopic simulation.
3 Key Inputs and Outputs
3.1 Data used
The main input to the baseline scenario was an openstreetmap file for the region Klagenfurt City including the next motorway nodes. The openstreetmap file was put into the SUMO Activity Gen (SAG) [27], a tool for automated activity-based scenario generation based on demographic statistic files and openstreetmap-data only. The generated network was broken down to the detailed network as shown in the chapter above. With this network, a more precise view was created by adding the following data sets offered by Land Kärnten and the pilot operator SURAAA:
- GTFS data by ARGE ÖÖV for baseline public transport coverage within the area of interest
- Traffic Signal programs for each of the four traffic lights in the area of pilot operations
- New traffic light added to the pilot routes for safe crossing of the main road connecting the motorway with Klagenfurt and the south-eastern area of Wörthersee
- Pilot routes by SURAAA
- Pilot specification taken from Navya-shuttle operations conducted at seestadt-aspern (projects auto.bus and Drive2TheFuture, both with AIT contributions) and adapted to new settings within Klagenfurt pilot.
With this data a baseline scenario was generated, the pilot routes were added as provided by SURAAA to scenarios one to four.
3.2 Extracted KPIs
The Simulation was carried out in MATSim. Several KPIs were calculated from the simulation results. The KPIs are from the areas of societal and traffic, energy and environment. Many other KPIs could be extracted from the simulation including changes in emissions (e.g. noise and air pollutants). The definition of the plotted measurements along with the corresponding related KPI follow:
Societal
- Empty vehicle km
- Shared Mobility Rate
Traffic, Energy, Environment
- Kilometre s travelled
- Modal split
4 Results
Overall, the simulations show that there is no significant influence of the automated shuttles on all routes on the overall traffic performance. This is the result of the setting with only one shuttle in peak-load environments on a two lane infrastructure and up to three shuttle on single lane infrastructure in low-traffic environment. As a result there is always ample chance to overtake the slow automated shuttles.
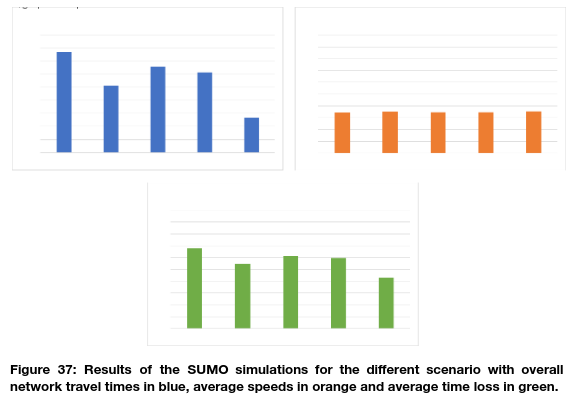
Results in Figure 37 show that there is very limited reactions on the shuttles. While the graph of the overall network travel times seems to show large differences, the actual travel time changes by only about 100 minutes which is about 0,12%. The travel times actually decrease very slightly which might be because the automated shuttles are overtaken with slightly higher speeds on the four lane roads, as shown in Figure 37 below.
Overall, the pre-demo simulations show that no actions are necessary to ensure traffic flow on the shuttle routes. However, the simulation shows a steady-state, where road users react to shuttle traffic like they would to common vehicles. In the initial phase of pilot operations (2-4 weeks from first use) there might be reactions of road users to the new mode of transport, attracting attention, e.g., the shuttle might be an eye catcher and an attraction leading to a slight slowdown in traffic in the vicinity of the shuttle.
It must be stated, that all situations, the shuttle operates in parts of the cities road network with higher traffic loads based on the function of the network (connecting industrial and retail areas) two lanes are available. Overtaking is possible and within the inner area of lakeside park small congestions occur that are dissolving within minutes.
As the simulation is not able to provide road traffic behaviour within changed traffic situations based on new and improved technology through onlookers, road traffic participants testing the autonomous functions of the shuttle, there might be diverging results during the first weeks of operation. With ongoing operation and habituation effects the traffic situation should be normalized again.
5 Strengths and Limitations
The usage of a microscopic SUMO simulation has several strengths:
- Detailed interactions of the shuttle with other traffic can be modeled including behaviour at bus stops, overtaking of the shuttle by other vehicles on main 4 lane artery into the city.
On the contrary, the present research does have certain limitations:
- Currently, pedestrians and bike traffic are not part of the simulation model. Since the shuttle is passing the university and a business park at least at times, there might be heavy pedestrian traffic on parts of the route. While this was out of scope of the research question in this period, there might be delays on route for the shuttle.
- Parameters for the Naviya Shuttle were used so far. These might not be applicable any longer with new shuttles being used in Klagenfurt now.
6 Conclusions
No interference of slow automated shuttle with traffic on main roads was detected, since the faster car traffic always has enough space to overtake automated vehicle on main roads.
It must be stated, that all situations, the shuttle operates in parts of the cities road network with higher traffic loads based on the function of the network (connecting industrial and retail areas) two lanes are available. Overtaking is possible and within the inner area of lakeside park small congestions occur that are dissolving within minutes.
As the simulation is not able to provide road traffic behaviour within changed traffic situations based on new and improved technology through onlookers, road traffic participants testing the autonomous functions of the shuttle, there might be diverging results during the first weeks of operation. With ongoing operation and habituation effects the traffic situation should be normalized again.