Madrid
Simulation Levels Connection Upscaling

1 Scope
This document outlines the methodology employed to conduct the transitions from microscopic to macroscopic simulations, i.e. upscaling, and presents the resulting data. Initially, microscopic simulations were conducted at SHOW pilot sites in Graz, Madrid, Salzburg, and Trikala. To generalize and analyze these findings on a larger scale, an upscaling methodology was developed. This process enabled a thorough transferability analysis of the results, ensuring their applicability and relevance across both the SHOW-specific sites and broader contexts.
2 Study Areas
2.1 Microsimulation networks
2.1.1 Trikala pilot site
The automated shuttles have been deployed along the peri-urban route of the Trikala pilot site that is depicted in Figure 1. The service route connects the Train Station with the Department of Physical Education and Sports Science, crosses different land uses (residential and non-residential), and is used by multiple road users (pedestrians, passenger cars, buses and trucks). There are 2 signalized intersections, 2 railroad crossings and 12 bus stations along the service route. The automated shuttles deployed along the service route are 2 electric Peugeot e-Traveller shuttles (4.95-meter vehicles with 8 seats).
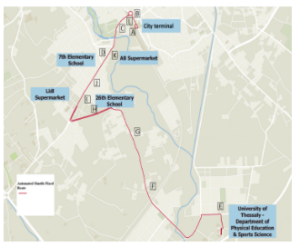
Figure 1: Trikala Pilot Site
The simulation network of the Trikala pilot site explicitly includes the peri-urban route that connects the Train Station with the Department of Physical Education and Sports Science and the train line that intersects the latter route. It consists of 80 nodes and 133 road segments, as depicted in Figure 2. In addition, the total length of the service route is 9.7 km and the network size reaches approximately 0.8 km². Furthermore, the simulated transport network includes at present 3 bus lines and 12 public transport stops, which were also included in the simulation model as well as frequencies and waiting times at stops, obtained from the website of the bus operator. The OD matrices that were utilised consist of 13 centroids, across the study network and the travel demand is 1,422 cars trips, 123 trucks trips and 2 train trips within midday peak hour.
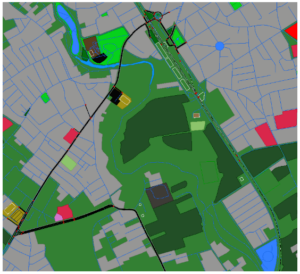
Figure2: Simulation network of the Trikala pilot site
The automated shuttles have been also integrated into the simulation model. They were simulated to run at fixed 30-minute intervals (i.e. there are two departures every hour). There were 12 bus stops along the 9.7 km long service circular route. The shuttles are electric and operate in automated driving mode throughout the whole route. The automated shuttles are Peugeot e-Traveller vehicles with a total capacity of 8 passengers; their dimensions are 4.95 m in length and 1.92 m in width.
The microscopic simulation analysis was conducted with the use of the microscopic traffic simulator SUMO. SUMO is an open-source microscopic traffic simulation software developed by the German Aerospace Center (DLR). SUMO is space-continuous, time-discrete, and can simulate large-scale road networks encompassing multiple transport modes and road users. A network topology including road-side infrastructure information (e.g., intersection control) and traffic demand are required inputs for SUMO simulations and have to be provided as XML files. Each vehicle moves individually in SUMO and has its own route. Longitudinal and lateral movements are dictated by car-following, lane changing, and gap-acceptance models as described in [1]. SUMO was initially developed and oriented for academic use to improve the validation of different traffic management applications. However, recently it is increasingly being used by the industry mainly for the simulation of surrounding traffic to test vehicles automations (such as ADAS and higher automation systems) considering V2X as well.
2.1.2 Graz pilot site
The test site Graz features some challenging urban environments with bus stops and pedestrians, busses, and public traffic. A shopping mall and several independent stores are the surrounding of the test environment.
The key objectives of the Graz site are the following:
- To integrate automated and connected shuttles into existing mobility services
- To enable automated vehicles to enter highly frequented public transport bus stops
- To perform safe detection of pedestrians and shuttle passengers at bus stops
- To create an automated shuttle line demonstrator linked to a bus stop
The Graz shuttle service, provided for SHOW project, connects the public transport hub Puntigam with the shopping center West. This testing environment (see Figure 3) is basically split in three major parts: (i) the train-, bus- and tram-stop (shown on the right), (ii) the bus-lane leading to the shopping center West and (iii) the roads within the shopping center (on the left side). Every section has its own challenges. The transport hub is served by six public bus lines, a tram line and it is also connected to an urban railway station (cp. Figure 4) and a small park-and-ride facility is also located in the immediate vicinity of the transport hub. Thus, many pedestrians roam around the area and cross the road in a very unstructured manner. The bus-lane connecting the transport hub with the shopping center is a restricted road section – only public busses are allowed to use it. Sporadically pedestrians walk on this road although they actually have a separate walkway. In the third section consists of a rather complex traffic layout within the shopping center with many lanes, curves and roundabouts and also high traffic volumes, especially during shopping hours.
The speed limit for driving is 30 km/h in those areas as the city of Graz has a general speed limit of 30 km/h excluding priority roads. An exception is the bus terminal, where a self-defined maximum speed of 10 km/h was chosen due to safety reasons and the larger number of pedestrians. On the whole route, the automated vehicle can encounter pedestrians and buses.
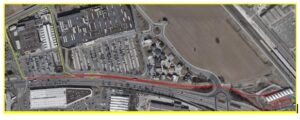
Figure3: Layout of the Graz site – restricted sections are colored red while public roads are indicated in yellow
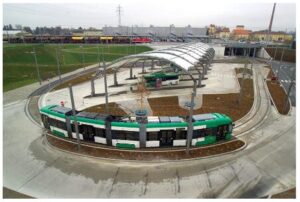
Figure 4: public transport hub Puntigam with bus, tram and train connections
An essential task of the automated journey is to drive through the bus terminal. Here, it must be determined which bus bay is available, i.e. free of buses, and where few VRUs are at risk. For this reason, the bus terminal digital infrastructure must allow to detect presence of buses and acquire information of buses arriving soon. The bus terminal is monitored via a smart camera system. It detects the bounding boxes of the objects in its view, classifies them and provides corresponding information locally to the C-ITS Road Side Unit (RSU), which further sends out C-ITS messages to the vehicles. In addition, AVs need to cross a tram track after leaving and before entering the bus terminal. This information is also conveyed via C-ITS to the vehicles.
Figure 5 illustrates what the automated driving software actually sees, when it is in front of the public transport terminal. The red points are points from the Lidar point cloud showing the surface of the road and any other objects in the 3D space. The green cubes and cylinders are recognized objects like buses and pedestrians. The predefined lanes through the bus stop area are coloured in cyan.
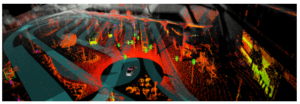
Figure 5: Sensor view from the vehicle when crossing the public transport terminal
The road network for SUMO of the Graz pilot site includes the track for the SHOW shuttles and the relevant surrounding road network. In Figure 6 an OpenStreetMap visualization of the pilot site can be seen. A priority 4-lane road B67a in west-east alignment essentially divides the map into two parts. North of B67a is the Shopping Center West – the destination. In the south there are further large shops. At its western end, B67a connects to a highway on-ramp. Eastward this road leads either toward the city center or toward the airport. In addition, various other businesses and restaurants are connected to this road toward the east. A single intersection connects the shopping center to road B67a (left side of Figure 6). Because of high traffic on B67a, the public transport busses have a separate, exclusive road between the bus terminal and the shopping center – which the shuttles are allowed to use. At the western end of the bus lane, an intelligent traffic light is installed which gives priority to traffic on the bus lane.
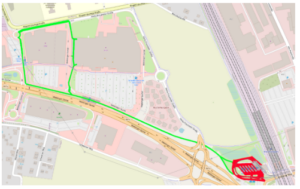
Figure 6: OpenStreetMap representation of the Graz Pilot Site
Highlighted in green and red are the roads used by the automated shuttles. The green road segments to and within the shopping center are modelled and simulated using SUMO. The roads and walkways within the bus terminal are painted in red. This is the part of the track, where the lane-based simulation of SUMO in not adequate to handle the pedestrians roaming around in various directions. Here the simulator of Autoware is used because a lower level of abstraction is needed. Within the Autoware simulator, static obstacles and moving objects can be placed. Based on this 3D scene, sensor data like Lidar point- are generated. By using the processing pipeline and algorithms of the real automated shuttle, the gap between simulation and real world is kept low.
While the Autoware simulation is as close to reality as one can get, there are two major downsides: Firstly, the entire scene and all traffic participants must be modelled – a huge effort for a large track. Secondly, because of the complexity and simulation details, a simulation run takes potentially a long time to finish.
Therefore, the major part of the track is simulated in SUMO to determine the required KPIs. Only in the area of the bus terminal the detailed Autoware simulation is used, where VRUs can be handled better.
Based on this OpenStreetMap, a simplified SUMO map is created by removing several insignificant roads and intersections manually. The remaining simplified map has still 282 road segments and 144 junctions (cp. Figure 7). Roads that are not logically connected (upper right) to the pilot site are eliminated. Minor roads within the shopping center that are not relevant for the pilot site (bottom) are reduced as well. The complex road network within the bus terminal is simplified significantly for SUMO by reducing the entire place to a simple connection lane.
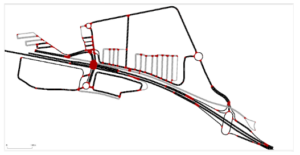
Figure 7: Simplified SUMO road network of the Graz pilot site
The main goal of the SUMO simulations is the generation of a realistic traffic load around the pilot site area for the automated shuttle to interact with. With a few assumptions about the intentions of drivers, it is relatively straightforward to generate reasonable traffic using SUMO: Most of the traffic on B67a is passing through from east to west and vice versa. A small fraction of the traffic enters the shopping mall, both north and south. Likewise, the parking lots and underground garages within the shopping center can be seen as a source of traffic. The majority of vehicles starting their journey there want to leave the shopping center using the road B67a. Some traffic is potentially coming from and going to the north using Herta-Frauneder street. Very important for the traffic simulation is bus line 65, which is using partially the same restricted roads as our shuttle service.
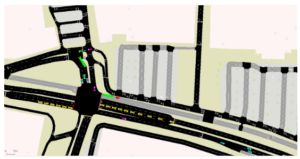
Figure 8: SUMO simulation of the major intersection within the pilot site.
A snapshot of the running SUMO simulation can be seen in Figure 8. For easier debugging purposes, different routes are using different vehicle colours. Red is reserved for the Show shuttle. Yellow vehicles are driving along the B67a, not really interacting with the shuttles path. Green vehicles are starting on the B67a and pass through the shopping center. Pink vehicles originate in the southern shopping center, cyan vehicles in the northern shopping center. 90% of the pink and cyan vehicles exit the scene using B67a, while 10% change between northern and southern shopping center. Busses of the public transport service are green too. Since they share the same restricted road, they have the most influence on the behaviour of the Show shuttle.
2.1.3 Madrid Pilot Site
One of the pilot sites of the SHOW project is the Madrid mega site, which aims to enable and provide safe, sustainable and integrated people mobility. The site concerns real (i) traffic shuttle service and (ii) bus depot operations. Specifically, the first investigation aimed to evaluate the impacts of various operational speeds for autonomous shuttle bus services on traffic safety using traffic microscopic simulation. A microscopic simulation analysis was performed for this reason in order to produce several measurements that quantified the effects of automated shuttle bus service under various traffic circumstances. In Villaverde, Madrid, many scenarios were created using the Aimsun Next mobility modelling software [2]. The second investigation aimed to investigate the impacts of real-world automated driving vehicle operation in a bus depot concerning road safety, traffic and the environment using field data from the Madrid site. For this purpose, the microscopic simulation method was selected as well, in order to provide impacts that could not be measured in reality. The real-life highly automated vehicles operate in a bus depot placed in the Carabanchel district of Madrid, Spain, which further designed in the Aimsun Next mobility software.
The aim of the Villaverde district site simulation is the implementation of an automated driving shuttle service route as is depicted in Figure 9. The service route is from point 1 – “Villaverde Bajo-Cruce” to point 10 – “La Nave”, which is a subway station. All the bus stations are fixed. The subway station (i.e., point 10) is the bus terminal, and it is surrounded by docks where the buses can park and wait until the departure time. However, routes’ frequencies are fully dependent on the charging periods of the bus batteries demand a stop of the service at certain moments of the day. With regards to bus specifications, the vehicle involved in this scenario will be a 12-meters automated driving electric bus (Irizar).

Figure 9: Villaverde District Site
The study network of the Villaverde district site included a subpart of the Villaverde district in Madrid, Spain. The network contains the wider area of AV shuttle service route connecting La Nave with the subway station of Villaverde. The simulation network consists of 365 nodes and 668 road segments, as depicted in Figure 10. In addition, the total length of road sections is 23 km and the network size reaches approximately 2 km2. Furthermore, the examined Villaverde transport network includes at present 23 bus lines and 39 public transport stops, which were also included in the simulation model as well as frequencies and waiting times at stops, obtained from bus operator websites. The OD matrices that were utilised consist of 30 centroids, across the study network and the travel demand is 5,784 cars trips and 716 trucks trips within peak hour.
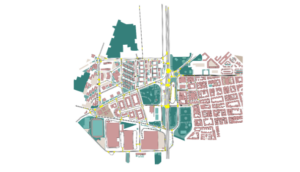
Figure 10: Villaverde Network in simulation software
An automated shuttle bus service has been integrated into the simulation network, as seen in Figure 11. There is a single automated shuttle bus that runs at a fixed 15-minute interval; i.e., there are four departures every hour. There are two bus stops along the 1.6 km long service circular route. The shuttle bus is fully electric and runs in automated driving throughout the route. It has been constructed by Irizar and has a total capacity of around 58-61 passengers with a 25 seating capacity; its dimensions are 12 m in length and 2.55 m in width.
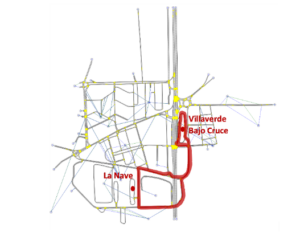
Figure 11: Villaverde simulation network and the circular route of the shuttle service
2.2 Macroscopic simulation networks
2.2.1 Salzburg pilot site
For the Salzburg Site, a mesoscopic simulation was set in MATSim [2]. The MATSim model for DOMINO Salzburg includes the city of Salzburg, large parts of the state of Salzburg, the German Corner (road network only) and small parts of Upper Austria (see Figure 12). From the national transport survey of Austria, Österreich Unterwegs 2013/14, a population was created which includes socio-demographic characteristics as well as the activity chain of the individuals. Currently, a population with around 33% of the total mobile population is simulated. The modes of transport available in the MATSim model are walking, cycling, public transport and car. In addition, the automated shuttle running in Koppl is simulated and, for more advanced scenarios, a Demand-Responsive Transport (DRT) service in the current region around Koppl that picks up passengers at the stops of the automated shuttle.
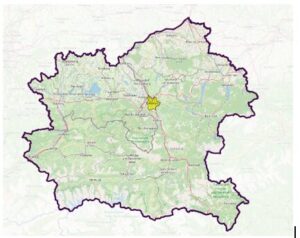
Figure 12: Simulation scenario including the area around Koppl as well as the city of Salzburg.
In the pilot, a fixed route (Figure 13) was be served by an autonomous DRT service that travelled with a top speed of 50 km/h.
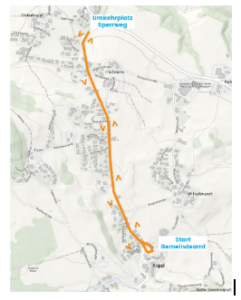
Figure 13: Route and stations of the DRT service connecting Koppl with a main bus line into the city of Salzburg
The study network for the MATSim simulation contains the network of the shuttle area of Koppl but also the network of the city of Salzburg and the surrounding regions (Figure 14). The Network was extracted from OpenStreetmap.
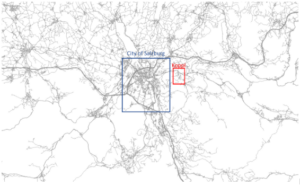
Figure 14: Simulation Network including Koppl and the City of Salzburg as well as surroundings
As described in section 3.3 six DRT-areas were defined for the DRT-scenarios D-G described below in Table 1. Each of the areas is served by a separate fleet of DRT-vehicles.
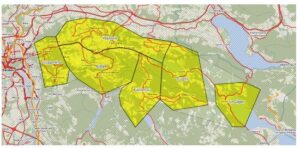
Figure 15: DRT-areas that are used in the Salzburg simulation.
2.2.2 Madrid pilot site
The Madrid pilot site network has been utilized for both microscopic and macroscopic simulation stages within the adopted methodology. This is made possible by the simulation software Aimsun Next [3], which is equipped to handle both levels of simulation. Consequently, the specifications of the network, previously detailed in the section on microsimulation networks, are directly applicable here. This dual-capability allows for a comprehensive analysis and simulation of the network, ensuring a detailed and accurate representation of traffic dynamics across different scales.
2.3 Tested Scenarios
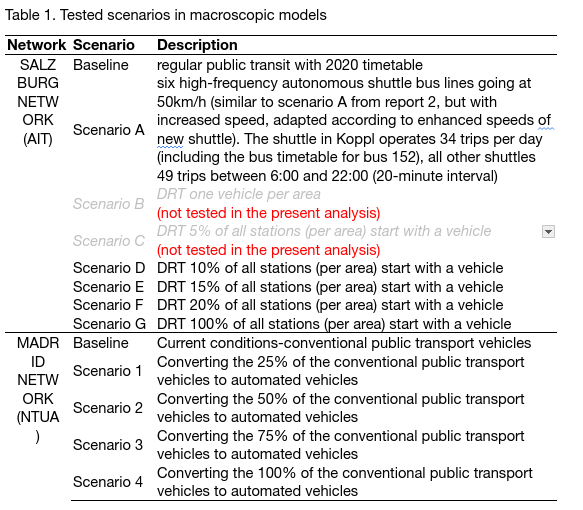
The upscaling procedure involved integrating the outputs of microsimulations into macroscopic models. Specifically, microsimulations were conducted at the afore mentioned pilot sites i.e., Trikala, Graz and Madrid, whereas macroscopic simulations were carried out for Madrid and Salzburg. Table 1 provides an overview of the scenarios tested within the macroscopic models for both cities.
3 Upscaling methodology
The methodology of upscaling automated driving simulation outputs that is followed within the present Deliverable was created by Tympakianaki et al. (2022) [4] and used within the LEVITATE project. In this methodology, the impacts of CAVs were assessed with respect to network performance. The considered steps of the up-scaling method are explained below.
1. Executing microsimulation: The travel time (seconds/kilometres) of public transport services is derived through the microscopic simulation processes. The methodology that is followed [4], suggests the use of the network capacity ratio to calculate PCU factors of autonomous passenger cars. In the present analysis, the travel time measure is selected to reflect more accurately the impact of autonomous public transport services compared to the impact of autonomous passenger cars market penetration rates that used to the followed methodology research.
2. Calculating PCUs: The PCUs are derived by the travel time ratio of conventional vehicles (CV) and AVs using the following formula:

3. Executing macroscopic simulation: The last step is to provide the PCU relationship as an input to the Volume Delay Functions (VDFs) of macroscopic models to forecast the potential macroscopic implications on the network performance. The VDFs are functions that model travel time among different parameters such as volume and capacity. For this reason, the macroscopic models apply VDFs in order for travel time values to be calculated.
The present upscaling approach was discussed within dedicated WP10 meetings and was approved by all involved SHOW partners.
4 Comparative analysis of autonomous vehicle impacts on urban transport networks: case studies of Salzburg and Madrid
The results from each of the three steps of the methodology followed by the pilot sites are summarized in Table 2.
Table 2. Results of the individual steps of the upscaling methodology
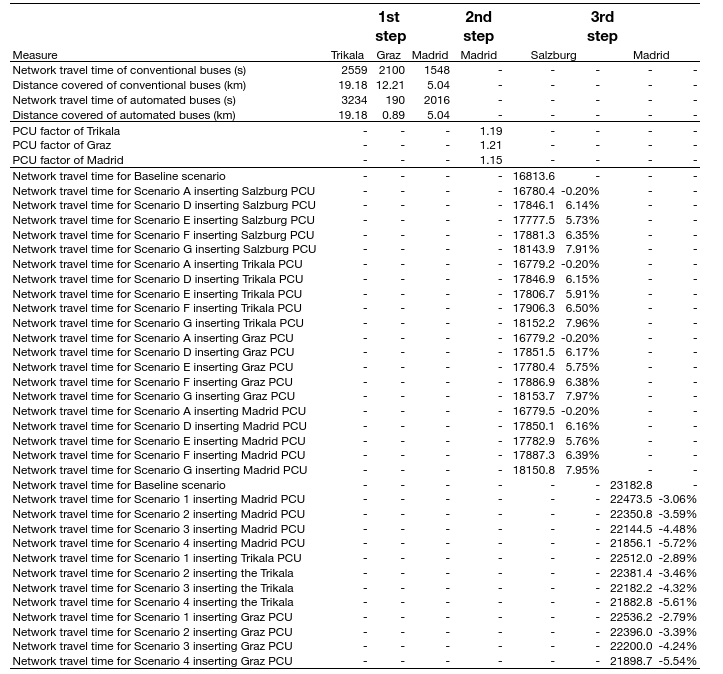
The integration of PCU relationships into VDFs for macroscopic models extends the simulation findings to forecast broader implications on network performance. This approach facilitates insights into how AV adoption could potentially impact urban mobility and congestion levels, essential for informing future transport planning and policy decisions. The following graphs (Figures 15 and 16) depict the results of the upscaling methodology. The graphs illustrate the impact of AV integration on network travel time across urban transport networks in Salzburg and Madrid. Each graph portrays multiple lines representing PCU factors derived from simulations in various cities: Salzburg, Trikala, Graz, and Madrid. The x-axis represents various simulated scenarios (Table 1), while the y-axis measures network travel time (Step 3) presented in Table 2, crucial for assessing the efficiency of public transport services.
In Salzburg’s graph (Figure 15), the lines for PCU factors from Trikala, Graz, and Madrid demonstrate noticeable similarities. Similarly, Madrid’s graph (Figure 16) also shows comparable trends among PCU factors for Trikala, Graz, and Madrid. These findings suggest that the methodologies used to derive PCU factors effectively capture commonalities in how AV adoption influences travel times across different urban contexts.
The similarity observed in the graph trends for both Salzburg and Madrid underscores the robustness of the methodology across diverse urban environments. Despite varying infrastructural and geographical characteristics, the graphs show consistent patterns, suggesting that AV adoption in transportation influences network travel times (up-scaled impact) similarly in both cities resulting in transferable results.
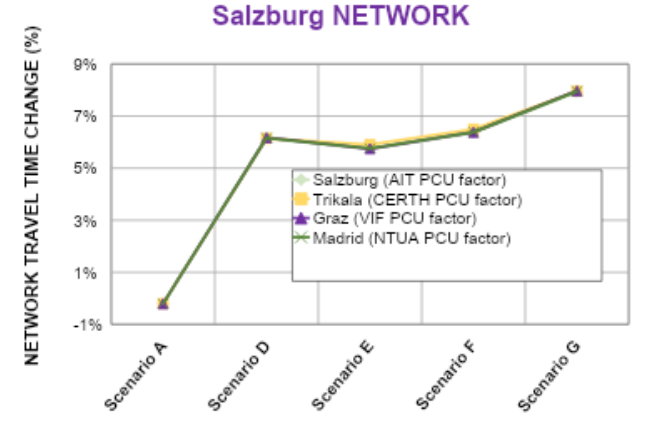
Figure 15: Total network travel time change for Salzburg network across different scenarios for four PCU factors
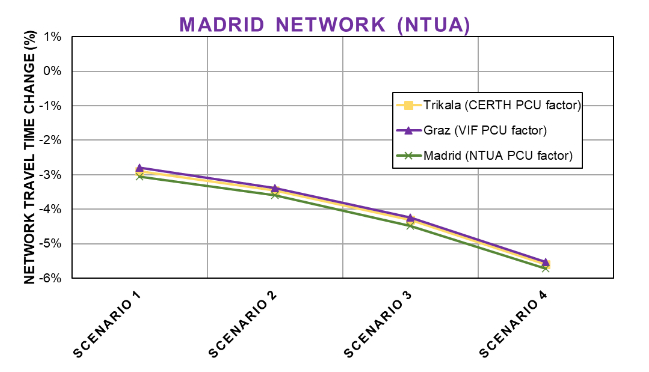
Figure 16: Total network travel time change for Madrid network across different scenarios for three PCU factors
In summary, the above graphs provide a visual representation of the study’s systematic approach and findings, highlighting the significant implications of AV integration on urban transport efficiency. This research contributes valuable insights into understanding and managing the transition towards autonomous mobility in urban environments.
5 Statistical analysis of PCU factor effects on urban transport networks
To assess the differential impact of PCU factors on urban transport networks in Salzburg and Madrid, an analysis of variance (ANOVA) was conducted. This statistical test evaluates whether there are significant differences in the means of PCU factors among different groups.
The descriptive statistics for the network travel times derived from the Salzburg network by the implementation of the PCU factor of the Trikala, Graz and Madrid networks that calculated from microsimulations as well as the PCU factor used in macroscopic simulations tested in Salzburg network are presented in Table 3.
Table 3. Descriptive statistics of the effects of four PCU factors on Salzburg network
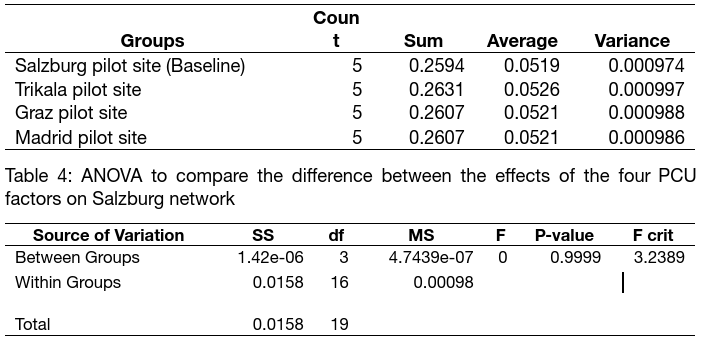
In the Salzburg network, the ANOVA results (F(3, 16) = 0, p = 0.999), as shown in Table 4, indicate that the mean effects of PCU factors (Salzburg, Trikala, Graz, Madrid) on travel time are statistically indistinguishable. This implies that, regardless of the methodology used to derive the PCU factors, their impacts on travel time in Salzburg are similar and can be generalized across different scenarios and network conditions. These statistics provide a detailed overview of the impact of PCU factors on network travel times in Salzburg, showcasing the consistency across methodologies derived from different urban networks.
Similarly, the descriptive statistics for the network travel times derived from the Madrid network by the implementation of the PCU factor of the Trikala and Graz networks that calculated from microsimulations as well as the PCU factor of Madrid network are presented in Table 5.
Table 5. Descriptive statistics of the effects of four PCU factors on Madrid network

Correspondingly, Table 2 presents the ANOVA results for comparing the effect of three PCU factors on the Madrid network.
Table 6: ANOVA to compare the difference between the effects of the three PCU factors on Madrid network

Similarly, for the Madrid network, the ANOVA results (F(2, 9) = 0, p = 0.964) show no significant differences in the mean effects of PCU factors (Baseline, CERTH, VIF) on travel time. This indicates that the choice of PCU factor methodology does not significantly influence travel time predictions in Madrid, supporting the transferability of PCU impact assessments across varying conditions.
Consequently, the results of the ANOVA tests for both the Salzburg and Madrid networks (Table 5 and 6) indicate non-significant differences among PCU factors derived from different methodologies. This non-significance suggests that the null hypothesis, which posits that there are no significant differences in the impacts of PCU factors on travel time across methodologies, is accepted. Therefore, the impacts of PCU factors derived from Trikala, Graz, and Madrid for Salzburg and Trikala, and Graz for Madrid can be considered transferable across the respective urban networks.
6 Implications for research and practice
The present document outlined an upscaling approach to bridge the gap between microscopic and macroscopic simulations. The analysis was based on four SHOW pilot sites in Graz, Madrid, Salzburg, and Trikala. This process enabled a thorough transferability analysis of the results, ensuring their applicability and relevance across both the SHOW-specific sites and broader contexts.
The methodology comprised three steps: (i) Executing microsimulation to obtain PCU factors of conventional passenger cars, (ii) Calculating PCU factors of autonomous passenger cars based on step (i) and (iii) Executing macroscopic simulation based on step (ii). The obtained results were analysed statistically using ANOVA tests.
The non-significant results from both ANOVA tests suggest that the impacts of PCU factors on urban transport networks are consistent and robust across different methodologies and cities. This consistency implies that findings related to PCU impacts derived from one methodology can reasonably be applied to other methodologies within the same urban context.
These findings are crucial for policymakers, urban planners, and researchers aiming to understand the broader implications of autonomous vehicle integration on urban mobility and transport infrastructure. By demonstrating transferability in PCU impacts, this research provides a foundation for developing unified strategies and policies that harness the potential benefits of autonomous technologies effectively across diverse urban environments.
References
- Lopez, P. A., Behrisch, M., Bieker-Walz, L., Erdmann, J., Flötteröd, Y. P., Hilbrich, R., Lücken, L., Rummel, J., Wagner, P., Wießner, E., 2018. Microscopic traffic simulation using SUMO. In 2018 21st international conference on intelligent transportation systems (ITSC) (pp. 2575-2582). IEEE.
- Multi-Agent Transport Simulation MATSim https://matsim.org/
- TSS-Transport Simulation Systems. (2019). Aimsun Next (Version 22) [Computer software]. TSS-Transport Simulation Systems. https://www.aimsun.com/aimsun-next/
- Tympakianaki, A., L. Nogues, J. Casas, M. Brackstone, M. G. Oikonomou, E. I. Vlahogianni, T. Djukic, and G. Yannis (2022). Autonomous Vehicles in Urban Networks: A Simulation-Based Assessment. Transportation Research Record, 03611981221090507. https://doi.org/10.1177/03611981221090507.