Karlsruhe
Simulating Automated Mobility
1 Scope
The test site Karlsruhe is a part of the German mega pilot site in the SHOW project. The goal of the test site Karlsruhe is to provide autonomous mobility and transportation services for passengers and cargo in a safe and integrated manner. Using a microscopic simulation of the site, the impact of the proposed solution can be investigated on different aspects such as traffic, safety and sustainability. Carla simulator is utilized as a simulation platform as it is a high-fidelity simulator which can support different sensor modalities providing the ability to test different perception, localization and planning modules in our driving stack before deployment in real-life. Furthermore, Carla has a flexible environment as a result of being an extension of unreal engine and supports the integration with external components using a python API.
The Karlsruhe Test Site consists of two subsites, namely the subsite “Campus-Ost” and the subsite “Weiherfeld-Dammerstock”. Both subsites are created as digital twins of their real counterparts. The maps of the subsites are created using high-definition (HD) maps in lanelet format. Re-simulating the HD maps help identify bottlenecks (e.g., critical intersections) and provide a more flexible environment for exhaustive testing. Injecting additional simulated traffic such as non-autonomous vehicles and pedestrians can also help to evaluate the automated driving function under more difficult conditions. The simulation results are directly used to enhance the real-world tests on the demo site.
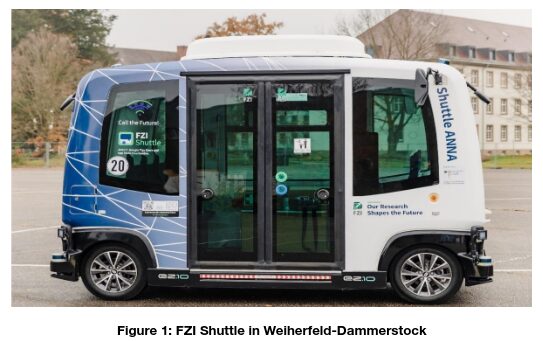
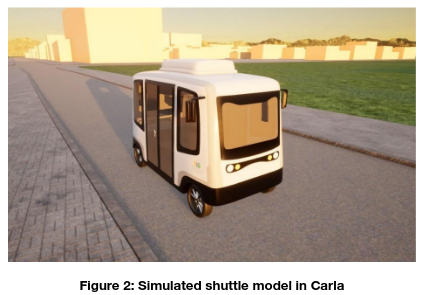
The shuttle bus considered for each subsite is the EasyMile Shuttles EZGen2 shuttles which are shown in figure 1. The shuttles are heavily modified both on hardware and software levels to better suite autonomous driving in a dynamic environment. As these modifications allow the FZI shuttles to operate without the need of a “virtual rail”, meaning that the path within the driving lane is planned on the fly during operation. To best mirror the real test sites, a model of the shuttle is developed in 3D software and imported to Carla using unreal engine extensions. The shuttle model can be spawned in Carla as seen in figure 2.
1.2 Weiherfeld-Dammerstock district description
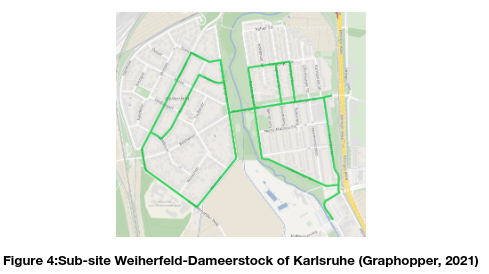
The subsite “Weiherfeld-Dammerstock” is located in the suburb of Karlsruhe, thereby providing many challenging traffic scenarios such as narrow streets and interaction with Vulnerable Road Users (VRUs). Figure 4 demonstrates Weiherfeld-Dammerstock aerial map. In this area, our autonomous shuttles have the legal permit to drive autonomously with a maximal speed of 20 km/h on public roads and in real traffic without dedicated lanes. The overall drivable streets by the permission add up to 5 km. The interconnectivity in Weiherfeld-Dammerstock is given due to direct connection of around 50 m to the next tram station.
1.3 Simulation network
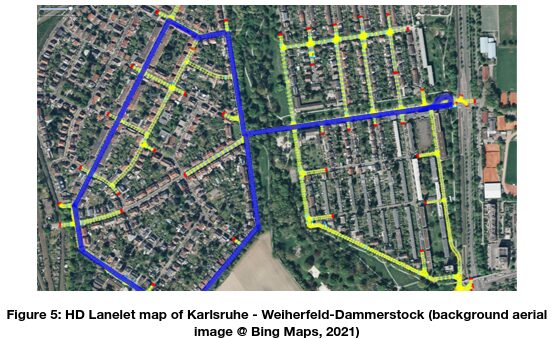
The simulation networks are the digital twins of the subsites “Weiherfeld-Dammerstock” and “Campus-Ost”. The street network can be seen in figure 5 extracted from HD maps in lanelet format.
1.4 Simulation parameters
The FZI’s HAD functions, implemented in ROS, is used to control the vehicle driving profile. Thus, the simulation heavily depends on the specific scenarios’ description. A scenario description entails information about the path of simulated VRUs, the start and end points of the FZI shuttle (ego vehicle), annotated speed limits and errors in localization systems. Furthermore, the specific planning software version of the AV influences the outcome of the simulation, e.g. due to a more aggressive or more comfort orientated set up of the controlling software.
1.5 Simulation scenarios
First, three simulation scenarios have been investigated in efforts to investigate the impact of an automated driving shuttle bus service operation. The investigated scenarios are as follows:
- Shuttle only simulation.
- SUMO traffic-only simulation.
- Shuttle and SUMO traffic simulations
In the shuttle-only simulations, a model of the shuttle controlled by the automated driving function is simulated within the digital twin in CARLA. In contrast, the SUMO traffic-only simulations only investigate simulated vehicles controlled by SUMO. In the third case, the combination of both is simulated: the shuttle moves on its predefined route, while at the same time additional traffic in the form of vehicles controlled by SUMO is added. For all of these simulations, vehicle tracks containing trajectories are recorded for later analysis. The analysis computes the following KPIs: total number of agents, elapsed time, KPI #2: Conflicts, KPI #12: Speed per vehicle type, KPI #14: Number of vehicles stops and KPI #15: Hard braking events in traffic.
Furthermore, additional simulation scenarios were investigated. The test case STS02 “Dynamic and static object detection” and PTS04 “Speed adaption” per their definition in D11.1. Each Test Case is defined by a sequence of Actions that have to be verified. The action sequence is verified in the Carla simulation as the action can be more tractable in controlled environment such as simulation when compared to real test.
Finally, in order to test the AV’s diagnosis system small positioning errors have artificially been induced into recordings of real autonomous drives in such a way, that the shuttle slowly drifts away from the lane centerline, thereby simulating a critical error in the localization system.
1.5.1 Simulation of STS02
Table 1 shows the formal Definition of STS02. Since the simulation of Step 4 is only informative for this Use Cases if the sensors and the environment of the AV are perfectly modelled, the FZI decided to focus on step 5.
|
Step |
Type |
Description |
|
0 |
Action |
Ensure that there are no obstacles around the route, including intersections with incoming traffic, that are not part of the test. |
|
1 |
Action |
Ensure that there are no static and dynamic obstacles that are not anticipated to be on the route. |
|
2 |
Action |
Attend to the vegetation maintenance on the side road and cleaning of the road. |
|
3 |
Action |
Ensure that all the parked cars are correctly parked and have pre-defined parking lot zones |
|
4 |
Verify |
The AV is able to detect the dynamic and static objects anticipated to be on the route. |
|
5 |
Verify |
The AV is able to avoid collisions with obstacles that could lead to a dangerous situation. |
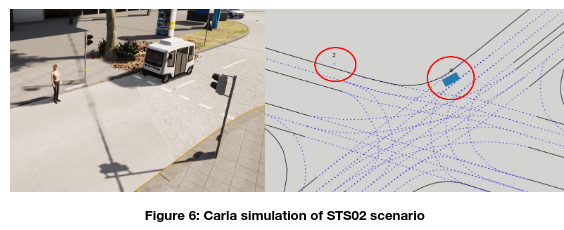
To simulate step 5 of STS02, a VRU was placed after a poorly visible corner. Figure 6 shows the scenario in CARLA on the left and from a more abstract top down view on the right with the AV starting position highlighted. The AV starts to accelerate and drives through the corner. At the same time the VRU starts to walk over the street in such a way that would cause a collision if the AV does not slow down. The AV’s path planning utilizes a HD-Map and the same HAD function that is deployed in the Demo phase real tests. The presence of the obstacle is provided via ROS to the planning software of the AV which modifies its trajectory accordingly.
1.5.2 Simulation of PTS04
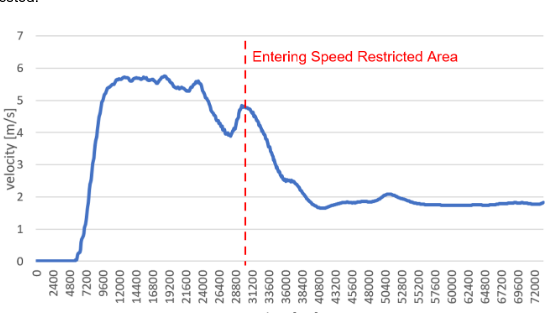
Table 2 shows the formal Definition of the action sequence to be verified in PTS04. The crucial action is described in step 3. Therefore, a defined speed has been annotated into the HD-Map of the subsite “Weiherfeld-Dammerstock”, which is used during simulation as well as during the Demo-Phase. During the simulation, the AV changes from a section with no annotated speed limit into a section with annotated speed limit. Since the AV has to decrease its velocity in a continuous way the main goal of this simulation is to verify that the correct speed is reached and that there are no critical side effects e.g. due to the characteristic of the control software.
Table 2: Formal Definition of PTS04
| Step | Type | Description |
| 0 | Verify |
Verify with the FAV’s OEM, integrator, or constructor which technology is chosen for speed adaptation: – Predefined speed zone in pathAnd / or – Adaptive Cruise Control and traffic sign reading – Other… |
| 1 | Verify | If in the pre-defined speed zone in path, verify that the information is shared with the site authorities during the mapping of the site according to the risk analysis that is done by OEMs (items considered: ODD, traffic density, visibility, localization, etc.). |
| 2 | Verify | Verify that the vehicle can adapt its speed depending on the environment conditions on specific sections on the path, (the ACC shall be tested apart from this requirement). |
| 3 | Action | This will be checked during the deployment on site. |
1.5.3 Simulation of a malfunctioning Localization System
As reported in D7.4 and in (Stefan Orf, 2022), the FZI introduced probabilistic diagnosis system for AVs, which relies on parametric modelling of random variables, that describe the performance of the localization system. An especially safety-related random variable is the “smallest distance to the nearest centreline”. To model this, various test drives have been conducted in the subsite CO. Figure 7 shows a visualization of the training trajectories, as well as the SLAM map and a grid map representing the number of data points per grid cell.
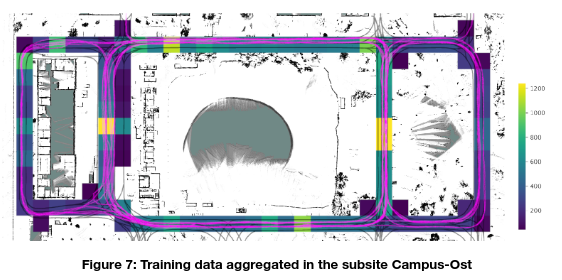
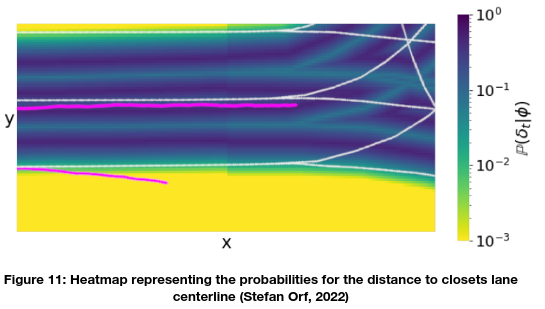
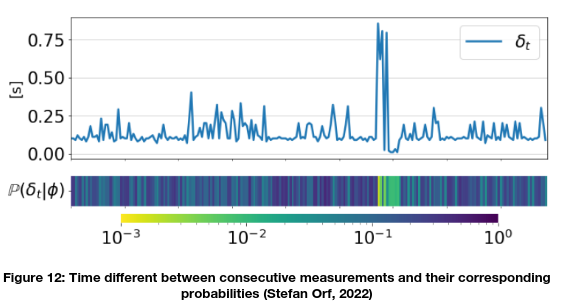
For each cell a predefined set of parametric distributions has been fitted, and the parameters of the best suited distributions have been stored. During operation, the “smallest distance to nearest centerline” is computed with live data. The outcome of this computation is then compared to the probability of such a value given the learned distribution parameters. Since a malfunctioning localization system is hard to test in real life operation recorded data was manipulated in such a way, that ROS messages that describe the current position of the AV have been manipulated with a linear increasing offset. A similar approach was taken for the random variable “timing discrepancy”, which describes the time difference between consecutive localization updates. In this case, recorded ROS messages were replayed during the simulation with varying speed for short amounts of time.

2 Tools
The microscopic simulation was conducted in Carla software. Carla is an opensource simulation software which is built on top of the unreal engine. Carla is frequently used in research due to being a high-fidelity simulation environment with support to different sensors commonly used in autonomous driving such as camera, lidar, etc. Carla represents HD-maps in OpenDrive format which can be easily converted in lanelet format. We are particularly interested in lanelet format as it is supported by the HAD functions. Furthermore, Carla provides a python API which supports development of simulation environment.
The Robot Operating System (ROS), a set of software libraries and tools that helps building robot applications, is used as a communication bridge between the Carla simulation and the implemented HAD functions. ROS can transfer the sensor data, map information, etc. from Carla to HAD functions as well as passing control commands from the HAD functions to the simulation.
3 Key Inputs and Outputs
3.1 Data used
The geometry of the both subsites are simulated in Carla based on OpenDrive. Carla supports OpenDrive format and takes multiple variables into account for each road segment such as road geometry, length, width, number of lanes and travel directions. Carla requires a binary (fbx) file as well to build the simulation environment. The binary file entails mesh of static objects in the environment such as buildings and traffic lights. A simplified version of the meshes can be created automatically using blender osm plugin. The traffic participants’ behavior in different simulation scenarios is generated and controlled by SUMO.
3.2 Extracted KPIs
As stated earlier, the simulation is carried out in Carla and ROS is used a communication bridge. The ROS bridge can extract information from the simulation and extract them as ROS topics. ROS topics can be stored into rosbag files for additional analysis. The stored rosbags can be used for calculation of KPIs such as total number of agents, elapsed time, Conflicts (KPI 2), Speed per vehicle type (KPI 12), Number of vehicles stops (KPI 14) and hard braking events in traffic (KPI 15).
4 Followed Models
The is no explicit driving model or behaviour followed in the developed HAD functions. Rather the HAD functions are adaptable and scalable due to being vehicle agnostic. The HAD functions include modules for localization, perception, planning and control. Raw sensor data and HD maps are used as the overall input of the driving functions.
- The localization module is a modified version of Simultaneous Localization and Mapping (SLAM) running on Lidar data and fused with information from real time GNSS signals.
- The perception module is responsible for detecting static and dynamic obstacles as well as tracking the detected dynamic obstacles. The tracking is based on intelligent driver model and extended Kalman filter.
- The planning module uses Particle Swarm Optimization (PSO) to generate sage and collision free trajectory that takes passenger comfort into consideration.
- The control module converts the planned trajectory into a steering and acceleration/deceleration commands which the vehicle use to drive in the environment.
5 Results
5.1 Impacts of automated driving shuttle bus service operations
As illustrated in the simulation scenarios (section 1.5), we first compare between three different simulation scenarios to identify the impact of the automated driving shuttle on the traffic flow. We carried out simulations with only the automated shuttle, only traffic participants whose behaviour is generated by SUMO and both the shuttle and the traffic participants. The results and measured KPIs are summarized in table 3.
Table 3: KPIs computed by the simulations in Karlsruhe.
|
KPI |
Shuttle-only |
SUMO traffic-only |
Shuttle and SUMO traffic |
|---|---|---|---|
|
Number of agents |
1 (1 shuttle) |
399 (399 cars) |
210 (1 shuttle, 209 cars) |
|
Elapsed time |
190.69 minutes |
157.23 minutes |
81.04 minutes |
|
Number of conflicts |
0 |
4 (2 SUMO vehicles too close to each other) |
1 (2 SUMO vehicles too close to each other) |
|
Speed per vehicle type |
Shuttle: 2.60 m/s (9.36 km/h) |
Car: 8.19 m/s (29.50 km/h) |
Shuttle: 2.63 m/s (9.48 km/h), |
|
Number of vehicle stops |
7 (planned stops) |
122 |
74 (Shuttle: 4 (planned stops), Car: 74) |
|
Number of hard braking events |
0 |
0 |
0 |
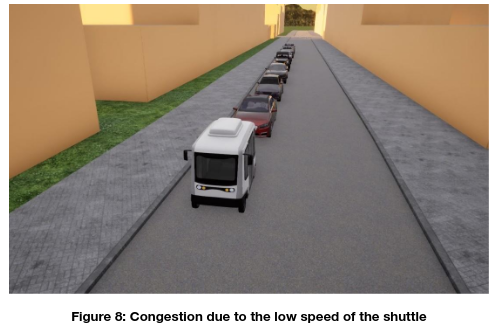
The shuttle-only simulations have proven that the shuttle can drive on the simulated road network without any conflicts and the average speed was 9.36 km/h. The shuttle only stopped at the predefined stopping points. For the SUMO traffic-only simulation, a total of 399 agents were simulated on the same road network. In this scenario, vehicles had to stop 122 times in order to give way. The average speed was 29.50 km/h, which was very close to the desired speed of 30 km/h. 4 Conflicts were detected, caused by agents being too close to each other. However, no collisions happened. In the combined simulation with the shuttle and additional vehicles from SUMO, the shuttle and the other vehicles correctly gave way and again, the shuttle was able to drive within the simulated world without any conflicts. One conflict occurred; however, it was caused by two SUMO agents which very too close to each other and the shuttle was not involved. The average speed of the shuttle was very close to the first case (9.36 km/h), but the average speed of the other cars decreased by 2 km/h and was only 27.50 km/h. This reduction of the average speed is linked to the existence of the shuttle in the simulation, the other vehicles were not allowed to overtake, and in turn, there was a queue behind the shuttle. The traffic congestion due the shuttle presence in the street is illustrated in figure 8.
5.2 Simulation of STS02
Figure 9 shows the velocity of the AV during a run of the STS02 simulation. The AV accelerates to a maximum speed of about 4.25 m/s before decelerating due the upcoming turn. After reaching the middle of the turn, the AV starts to accelerate again until the VRU is detected, which results in deceleration. Although the deceleration starts very early the AV does not reach a standstill but continues to drive slowly towards the obstacle. Once the VRU has left the area in front of the AV, the AV start accelerating again. The smoothed character of the curve is heavily influenced by the AVs controlling software, which can be seen in the continuously decreasing braking acceleration and the noisy velocity signal during low speed. Although the AV’s behavior is heavily influenced by the controlling software, the AV’s behavior is in line with the requirements of D11.1. Nevertheless, this test should be repeated for every software update that influences the controlling software.
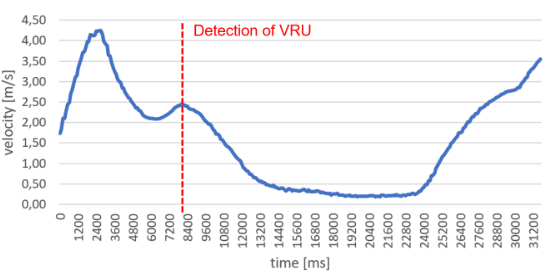
Figure 9: The AV’s speed during the simulation of STS02
5.3 Simulation of PTS04
Figure 10 shows the velocity of the AV during the simulation of PTS04. Similar to the simulation of STS02, the AV accelerates to its maximum speed followed by a phase deceleration due to an upcoming corner. After reaching the midpoint of the corner the shuttle starts to accelerate again until the speed restricted area is reached. The following deceleration phase follows an undulating form, which is also due to the character of the controlling software. It is worth noting that this behaviour leads to velocities that exceed the speed limit of 2 m/s. Although this speed excess is negligible, it shows that the controlling software plays a major factor in the safety of an autonomous vehicle at that updates regarding this software should be carefully tested.
5.4 Simulation of a malfunctioning Localization System
Figure 11 shows the probabilities for each possible position within the displayed map section as well as a record of an error free trajectory and a simulated erroneous trajectory, leading to the AV leaving the lane. The displayed map is created by the computation of the distance to nearest centerline for every pixel, which is then used as in input for the probability computation given the fitted distributions parameters. Since the AV only has one pose for each timestep, the computation in the diagnosis system gets much more lightweight. Details for this computation can be found in (Stefan Orf, 2022). One can clearly see, that the probabilities for localization positions outside of the lane are extremely low. Even Poses near the border can be detected as erroneous, depending on the probability threshold of the diagnosis system. An advantage of this method over strictly forbidding the AV to leave its lane, is that the methods allows different margins for different sections of the map.
The upper half of Figure 9 shows a record of typical time differences between consecutive localization systems, which was modified in such a way, that for a short amount of time the corresponding ROS messages were replayed faster or slower than normally, thereby simulating a malfunction regarding the update rate of the localization algorithms. The lower half of Figure 9 shows the corresponding probabilities for the measurements above. One can clearly see, that the erroneous measurements corresponds with low probabilities, which leads to warnings from the diagnosis system.
6 Strengths and Limitations
The conducted traffic microsimulation research provided several strengths:
- The Carla simulation provides a high-fidelity environment for testing of new mobility technologies and driving software before testing in reality.
- The simulation environment provided a proper platform for assessing the impact of the deployed shuttle bus and its max velocity on the traffic flow and delay on other traffic participants.
- Using Carla, the HAD functions can be tested with sensors models and setup similar to the one on the real shuttle providing validation and verification stable environment.
- The HAD functions don’t follow a virtual rail but rather utilize the sensors inputs to modify the shuttle trajectory in a reactive manner. The adaptability can be observed in simulation scenario “STS02”.
- The generation of a digital twin of the subsites even with a more simplistic furniture and building is useful as it can provide insights into critical and corner case scenarios which are challenging to the shuttle driving stack. Using these insights, the HAD functions can be optimized to provide smoother rides with better safety grantees. One example can be scenario “PTS04”, which provides assurances that the shuttle has a correct behavior when entering speed restricted areas.
- The integration of system diagnostics and malfunction detection increases safety and reliability of the overall system.
- The obtained results could guide stakeholders and practitioners as the examined scenarios included fundamental aspects for future conditions, such as automated private and public transport vehicle operations.
- Findings can also aid to accelerate the development and deployment of autonomous vehicles and to improve their safety and reliability on the roads.
On the contrary, the present research does have certain limitations:
- Simulation results show that introducing the shuttle with its current speed limitation can cause a congestion in the traffic flow.
7 Conclusions
“The simulation showed that shuttle with their current speed limit introduce congestion in the traffic flow, however this delay is acceptable especially in urban roads. The simulation of digital twins of the test subsites provided insights into the challenging scenarios that can be faced. The implemented HAD functions provide a high level of reactivity to the environment, such as changes in speed limits, pedestrians crossing intersection and more. Coupled with diagnostic systems the reliability and safety of such systems can be enhanced.”
References
- A. Kesting, M. Treiber, and D. Helbing, “Enhanced intelligent driver model to access the impact of driving strategies on traffic capacity.,” Philosophical transactions. Series A, Mathematical, physical, and engineering sciences, vol. 368, 2010
- SHOW Deliverable D7.4
- S. Orf et al., “Modeling localization uncertainty for enhanced robustness of automated vehicles,” in 2022 IEEE 18th International Conference on Intelligent Computer Communication and Processing (ICCP), 2022, pp. 175–182
- SHOW Deliverable D11.1
- SHOW Deliverable D11.3