BRAINPORT
Simulating Automated Mobility
1 Scope
In the simulation of Brainport site, the effects of a Demand Responsive Transit (DRT) service in Eindhoven (The Netherlands) is studied via a macroscopic traffic simulation at a city level. With a DRT service, a passenger requests a vehicle for a trip and picked up by an available DRT vehicle. This DRT vehicle drops off the passenger at the desired destination and drives (empty) to a new location to pick up a new passenger.
Typically, modelling DRT service is realized via a microscopic simulation for the required matching of vehicles with passengers. However, many strategic questions regarding the introduction of a new service such as DRT are typically answered with macroscopic (strategic) transport models. Questions can be: How often will these kinds of vehicles be used, and for what kind of trips do they form an attractive alternative (i.e. for commuting or leisure)? or what will be the impact on congestion levels if DRT vehicles (or large fleets of taxis) are allowed in the city centers?
In order to investigate the impacts of a DRT system at a city level, two simulation tools are integrated and used: Urban Strategy and New Mobility Modeller. Urban strategy is a simulation platform for digital twins and New Mobility Modeller is a mode choice model to investigate the change of modal choice by a new mobility concept (in this case, DRT vehicle). This simulation aims to quantify the impacts of a Demand Responsive Transit system on a city, in terms of modal choice, congestion and travel times, in different scenarios and implementations of the DRT service.
1.1 Simulation network
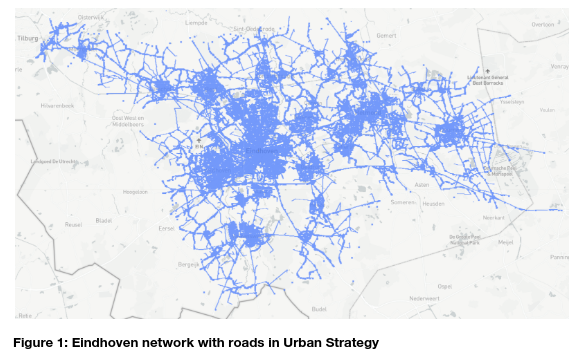
A simulation area including the city of Eindhoven and its surrounding towns is chosen. The simulation network is a cut-out of an existing transport model derived from the BBMA (BrabantBrede ModelAanpak). In this area, one airport and eleven train stations are included. The modelling year chosen is 2030, and the morning peak period (7.00-9.00) of an average weekday is modelled. The simulation network consists of 3611 traffic zones, 90,596 roads and 302 transit lines. Figure 1 shows the roads that are present in the network, visualised in Urban Strategy.
This simulation network includes multiple lines of trains and buses. As shown in Figure 2, the green lines are bus connections and the yellow lines represent train connections. The train lines are connected to Best and continuing to ‘s-Hertogenbosch or Tilburg in the north, to Helmond and Venlo in the east, and to Geldrop and continuing to Roermond in the south. The bus lines are mainly focused within Eindhoven city, as well as connections to and between the neighbouring towns.
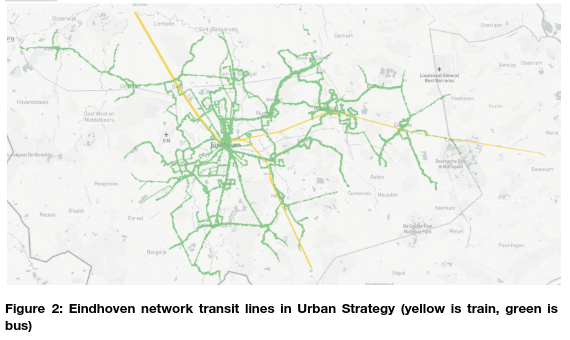
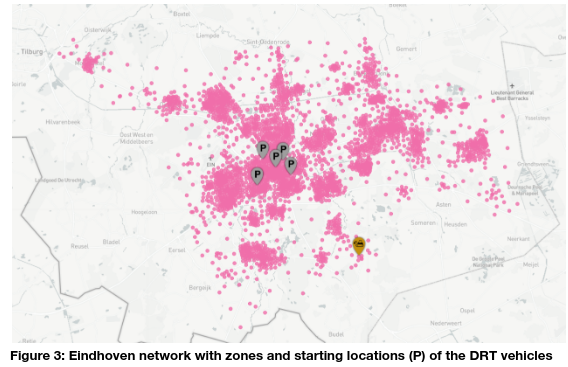
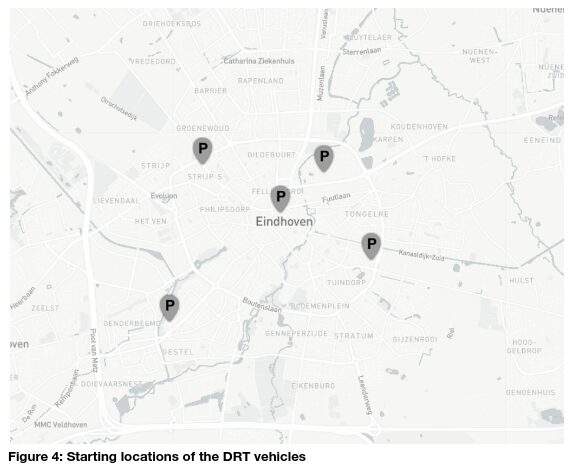
Figure 3 shows the traffic zones defined in the network, each pink dot representing a zone. Additionally, the parking locations of the DRT vehicles (marked with P) is shown. The parking locations of DRT vehicles are the starting locations of simulated DRT vehicles in the network.
1.2 Simulation assumptions and parameters
DRT vehicles are allowed to drive on all roads, and can pick up people within the whole Eindhoven region. It is not possible to leave the simulated zone using a DRT vehicle, so all trips are internal within the simulated area.
Some parameter settings for the DRT vehicles are used. These are the costs, which are in the base situation 3 euro fixed costs, and 1.58 euro per kilometre travelled. For the first iteration of modelling, a searching time (waiting time) of 0 minutes is used for the DRT vehicles. In the next iteration, the model will compute the waiting time from the result of the previous iteration.
A departure time profile is used to convert the OD matrices to trips that depart at a certain time. This departure time profile is assumed evenly distributed over a period between 0 and 120 minutes. The morning peak lasts for 2 hours (120 minutes).
The vehicles are evenly spread over 5 starting locations (Figure 4): Eindhoven Centraal station, University, Strijp-S and two roads that are on the edge of the centre of Eindhoven. In the base case, 1000 vehicles are modelled, which means 200 vehicles are starting at each of the 5 locations. At the end of the simulation period, vehicles have to end at their respective starting location.
Even though the modelling period consists of two hours, vehicles are allowed to drive around for 180 minutes. This allows DRT vehicles to start driving to their first trip before the morning peak start, and drop off their last passenger which is still picked up within the modelling period.
In each iteration, the traffic is assigned using a 10-iterations Volume Averaging (VA) assignment. A multi-class assignment is used, where freight is assigned using All-Or-Nothing, and ‘normal’ cars and DRT vehicles are assigned using VA.
1.3 Simulation scenarios
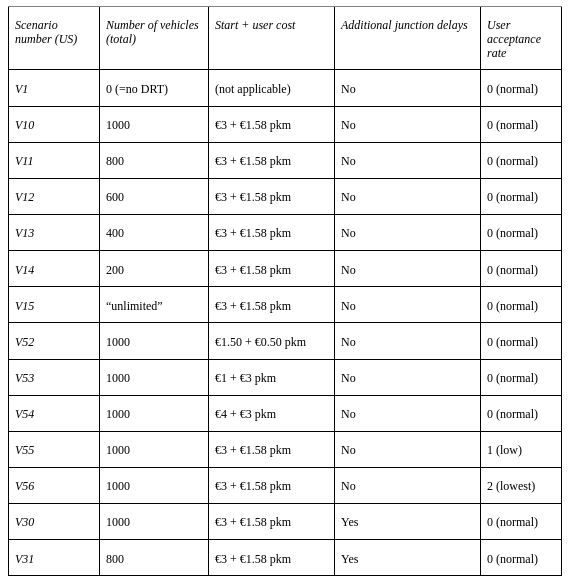
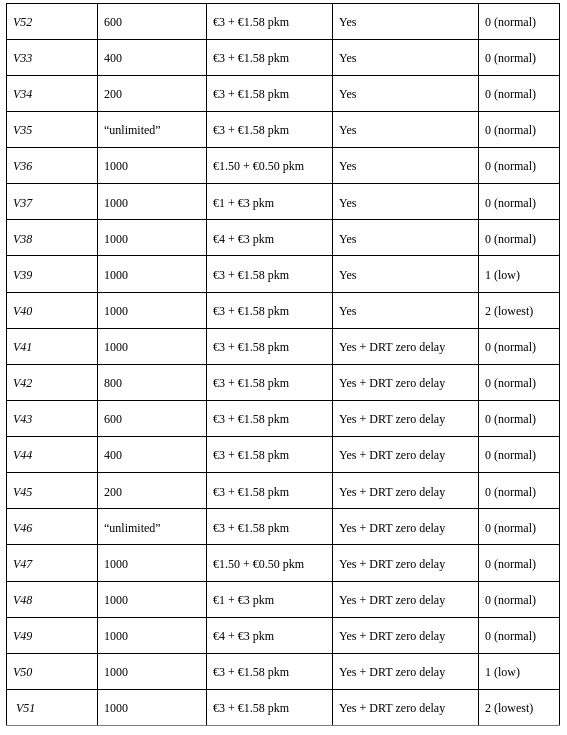
In total, 34 scenarios (one base case and 33 variations) are simulated. The base case has no active DRT service and the other scenarios are the different combinations of following variables:
Junction delays:
- Base: no junction delays
- Yes, additional junction delays are incorporated for signalised intersections.
- Yes, junction delays of DRT vehicles are shorter than normal, based on the assumption that DRT vehicles do not experience any delay at signalised intersections due to green priority everywhere.
Fleet size (DRT vehicles):
- Base: 1000 vehicles (200 per location)
- “Unlimited” (10,000 per location)
- 800 vehicles (160 per location)
- 600 vehicles (120 per location)
- 400 vehicles (80 per location)
- 200 vehicles (40 per location)
Costs per trip and per kilometre (DRT vehicles):
- Base: 3 euro fixed, and 1.58 euro per km
- Cheap: 1.50 euro fixed, and 0.50 euro per km
- Discouraging long trips: 1 euro fixed, and 3 euro per km
- Expensive: 4 euro fixed, and 3 euro per km
User acceptance rate (general attractiveness of DRT service):
- Base: 0
- Less attractive: 1
- Very unattractive: 2
Table 1 lists the simulation scenarios with corresponding experiment variables.
2 Tools
2.1 Urban Strategy
Urban Strategy is a tool, developed by TNO, to work with digital twins of cities or regions. Several modules are available within Urban Strategy, such as a mode choice model (New Mobility Modeller), assignment modules (Traffic+, Public Transport) and a module for computing air quality (Air). The simulation performed by Urban Strategy outperforms other simulators with traditional traffic models or air quality models in terms of computation time. This is contributed by a parallel programmed algorithms and use of state-of-the-art hardware that limit the computation time to seconds (rather than hours/days as in traditional models).
Urban Strategy has a flexible and extendable structure for sub-model developments. It is possible to integrate different models, while using the same framework and base data. Moreover, the visualisation of different ‘layers’ is possible in Urban Strategy. Map-based data can be shown in a simple and interactive manner. Map-based data include both base data, input data, as well as computed output data and KPIs.
3 Key Inputs and Outputs
3.1 Data used
Urban Strategy always uses an existing traffic model as a basis, in this case the BBMA (BrabantsBrede ModelAanpak) year 2030. OD matrices and the traffic network including network for public transport are derived from the BBMA model. For the OD matrices, data of a morning peak is selected, containing the modes: truck, car, public transport and bike.
The network contains all links used for car, bike, and public transport and each link carries a speed and capacity to be used in the assignment. The assignment is done using a Volume Averaging assignment for car, with truck as pre-load. The more traffic is present on a link, the higher the travel time will be for that link. For bike and trucks, an All-Or-Nothing assignment is used. For public transport, a frequency-based assignment algorithm is applied.
In the assignment for car, junction delays are considered. These are derived from the traffic level (microscopic) simulations. Each junction type modelled in the traffic level simulations is matched to certain junction and/or junction type in the city level simulation, so that the delays from the different ingresses as computed in the traffic level simulation can be used in the city level simulation.
3.2 Extracted KPIs
Several outputs can be retrieved from each scenario of the simulations. Primary outputs will be (1) modal split, i.e. the number of trips per mode, or the share of each mode; (2) travel times and vehicle kilometres travelled by car and by Demand Responsive Transit vehicles; (3) road intensities of car and DRT vehicles. Also KPIs on emissions and noise are available, such as CO2, NO2, PM2.5 and PM10 emissions, and noise levels.
Specifically for the DRT system, available KPIs are the number of trips served by DRT, the (time) usage of the available DRT vehicles and the number of vehicle kilometres travelled by DRT vehicles.
The full list of KPIs that can be computed is:
- Total network travel time per vehicle type
- Modal split
- Total mileage
- Total network delay
- Average network speed
- Number of trips
- Total energy use per vehicle type
- Total emission per vehicle type
- Concentrations (air quality)
- Noise
- Amount of travel
- Simulated empty vehicle kms
4 Followed Models
4.1 Framework
For modelling the impact of DRT vehicles on a regional level in a macroscopic transport model including mode choice, we use the framework as shown in Figure 5. In the framework, an Origin-Destination (OD) trip matrix of people that would like to travel using a DRT vehicle is generated using a mode choice model. This OD matrix indicates the number of people that would like to travel with a DRT vehicle. The number of people that want to travel using a DRT vehicle, is not identical to the number of vehicle trips, since in the vehicle trips also the empty vehicle kilometres travelled should be included. Empty vehicle kilometres travelled are the trajectories where the DRT vehicle is moving from the drop-off point of one passenger to the pick-up point of the following passenger without any other passengers onboard. This information on empty trips is necessary to be able to compute congestion levels as a result of the empty vehicle kilometres – which will in fact lead to longer travel times and affect the modal split (for both private car and DRT usage).
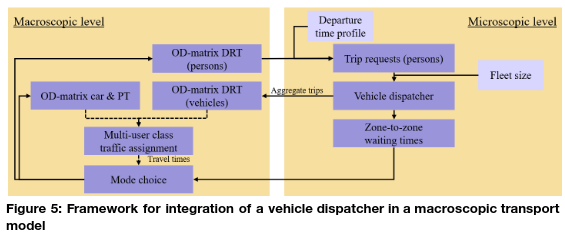
In order to go from an OD matrix of persons to an OD matrix of vehicles, a vehicle dispatcher is run, which matches passenger requests to specific DRT vehicles, and determines the empty trips of the vehicles as well. A vehicle dispatcher needs information on the exact departure time to schedule trips one after another. Since the OD matrix does not contain this detailed departure time data, but only contains information on the number of trips performed during a larger time period (e.g. a two-hour morning peak period), the macroscopic aggregated OD matrix of trip requests is first disaggregated to individual trip requests using a departure time profile. This disaggregation of the OD matrix of persons results in a list of trip requests with a desired start time, a start location (origin) and a destination. This is the first processing step, starting with an OD matrix of persons that want to use DRT, using a departure time profile, to trip requests (persons).
These trip requests on microscopic (individual, agent) level are matched to DRT vehicles using the vehicle dispatcher. Additional input used in this step is the fleet size: the amount of vehicles present in the network to serve trip requests, including the start locations of the vehicles. The fleet size is fixed in each scenario, i.e. a fixed amount of DRT vehicles are modelled. The fleet size and starting location influences which trips are served (first) and how many trips can be served in the modelling time period. The matching process between trips and DRT vehicles is performed by a simple greedy algorithm where first the trips are sorted on request time and travel distance, after which the trips are planned one by one given the at that moment closest available DRT vehicle such that the deadheading is limited. In a later stage, this greedy algorithm can be replaced by an advanced vehicle dispatcher algorithm using linear optimization techniques of sophisticated branch-and-bound algorithms, possibly including shared rides. The outcome of the matching is a sequence of destinations (stops) visited per DRT vehicle, including which passenger trip requests are served by the vehicle. This sequence of stops is available for each DRT vehicle. The sequence of trips that each DRT makes is then aggregated again to an OD matrix in the step ‘aggregate trips’. The resulting OD matrix resembles trips made by vehicles as opposed to persons, which is what the algorithm started with.
This resulting OD matrix of vehicle trips can then be assigned to the network using a (macroscopic) traffic assignment algorithm, which in the case study is a Volume Averaging traffic assignment. Multiple user classes are used to also model other traffic, such as normal cars and trucks. The assignment determines the realised travel times between zones (including congestion) as its main output. The average waiting times for people travelling with DRT vehicles is an output of the dispatching algorithm, resulting from the sequence of trips served by the vehicles and the time that each passenger has to wait from the trip request time to the time that the DRT vehicle arrives to pick them up. The two outputs together (travel time and waiting time) are used as an input for the next iteration of the mode choice model, determining how many people will use the DRT system given the realised circumstances. Thus, in the next iteration the resulting travel and wait times are used as input of the mode choice for DRT, as well as in the travel times for car. In this way, a new OD matrix for DRT (persons) is generated again, and the steps described above can be followed again. This process can be repeated until a stable situation is generated (equilibrium) where the travel and waiting times and modal split do not change (much) anymore between iterations.
The DRT framework as shown in Figure 5 is implemented in Urban Strategy [1] [2], a Digital Twin tool developed by TNO consisting of several modules including a mode choice module (as described in [3]) and multi-user class traffic assignment.
4.2 New Mobility Modeller
The mode choice module (New Mobility Modeller) is specifically developed to explore the mobility impacts of connected and automated driving and shared mobility, using a multinomial logit model for mode choice estimation [3]. The population characteristics of the Traffic Analysis Zones are matched to the Origin-Destination trip matrices using survey data, and contains data on agent characteristics (for instance age, gender, driver license ownership) and household characteristics (such as income, car ownership). This provides the possibility to re-assess the mode choice in a new situation where new modes are included, which may be modes that do not yet exist in our transport system. In our study, besides car and public transport, DRT is added as a new mode. The travel time, waiting time, travel costs and mode specific constant form the generalised costs, which is the basis for mode choice. The same cost parameters are assumed for DRT as for the normal private car, except for the addition of waiting time. The number of trips (also called requests) is an output of the mode choice module.
4.3 Implementation
The mode choice, vehicle dispatcher and traffic assignment modules are partly implemented using state of the art GPU technology for parallel computing, resulting in fast travel times of approximately 5 seconds (vehicle dispatcher), 10 seconds (mode choice) and 15 seconds (traffic assignment) on a computer (CPU: Intel Core i9 3.3GHz, Memory: 32 GB, GPU: Nvidia TITAN RTX with 40 GB GDDR). The models run interactively, i.e. they respond to changes in output of the other models. First, the mode choice module estimates the number of trips (i.e. number of requests) performed with DRT vehicles. The mode choice model estimates for each trip which mode is used. In the first iteration, it is assumed that the average waiting time for a DRT trip is zero. This leads to a new modal split, and thereby also a number of trips that use the DRT mode. This triggers the vehicle dispatcher, which assigns DRT trips to actual vehicles. As a result, the average waiting times for each OD pair are updated, and the DRT vehicle trips (including the empty trips with no passenger onboard) are updated in the OD matrix. Next, the mode choice module runs again (using the updated waiting times), triggering the vehicle dispatcher. After 10 iterations of mode choice and vehicle dispatcher an equilibrium is reached, and the traffic assignment module assigns the DRT vehicle trips (as well as the normal car trips) to the network, leading to updated level-of-service matrices, i.e. the travel times and travel distances between all OD pairs. The updated level-of-service matrices trigger a new set of iterations between the mode choice module and vehicle dispatcher, leading to a new mode choice. This iterative process is run 5 times. This implies that for a full run the mode choice and vehicle dispatcher modules are run 50 times in total (5 runs of 10 iterations each), and the traffic assignment module 5 times.
5 Results
In this section, a selection of the results of the 34 scenarios is shown. In Figure 6, we see the effect of the fleet size (number of DRT vehicles available for requests) on the number of trip requests, and the number of requests served. In these scenarios, the price, delay and attractiveness are kept constant. In some scenarios, the number of trip requests is higher than the requests served, which means that the DRT vehicles are insufficient to serve all passengers that would like to use a DRT vehicle to their destinations. In this scenario, a fleet of 600 vehicles is sufficient to serve all requests. The larger the fleet, the more trip requests are being made (and served).
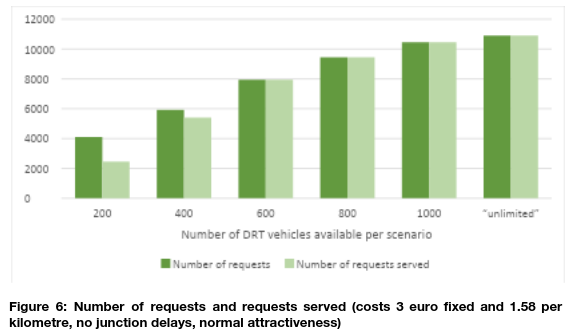
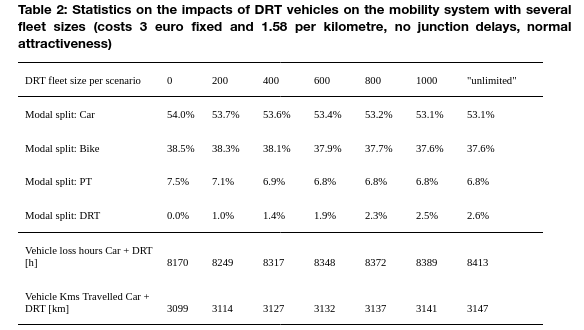
Table 2 indicates the results on modal split and vehicle loss hours and vehicle kilometers driven. The fleet size is varied while the price, delay and attractiveness remain constant. It shows that the more DRT vehicles are available, the larger the modal share of DRT is. Additionally, the share of DRT and car combined increases with larger fleet size, which means that the DRT service mainly takes away the share of public transport (PT) and bike. This is also represented in the vehicle loss hours (shown for car and DRT together) and vehicle kilometers travelled (also shown for car and DRT together). An increased fleet size suggests more vehicle kilometers travelled, more vehicle loss hours and thus more congestion on the roads of the network.
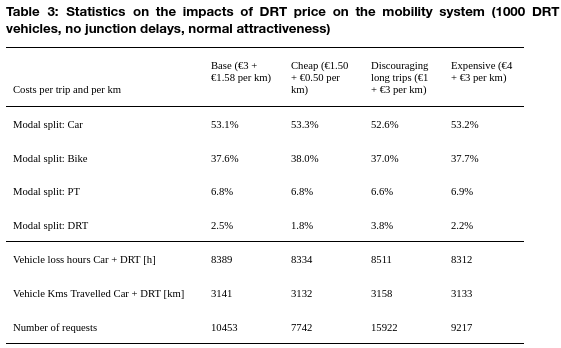
The impacts of DRT service price is revealed in Table 3. Compared to the base case, the number of trip requests increases substantially in the scenario in which long trips are discouraged, while increases of vehicle loss hours and vehicle kilometres travelled are small. This implies that the trips served in this case are shorter trips and a DRT service designed for short trips is more attractive than a service designed for longer trips.
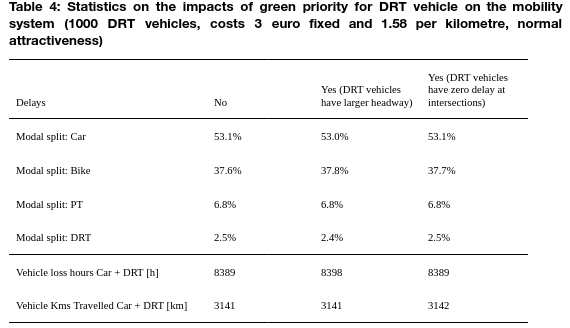
Furthermore, Table 4 presents the effects of junction delays, whether a DRT vehicle can receive green priority at intersection, on the DRT service statistics. When the DRT vehicle experience larger headways due to vehicle automation, the modal share of DRT decreases slightly, and the vehicle loss hours increases. However, the effects are marginal. When DRT vehicles get priority and encounter zero delay at intersections, no effect on the outputted KPIs is observed.
6 Strengths and Limitations
The proposed simulation framework is a novel way of modelling Demand Responsive Transit and assessing its impacts on traffic flow and environment. The framework consists of a method to combine the microscopic nature of the DRT service with the macroscopic transport model which allows for strategic decision making for cities. This implementation, which translates aggregated macroscopic matrices to individual requests and back to aggregated matrices, combined with a mode choice model, is a novel approach.
In the future, this framework can be used and extended to improve the predictions of the effects of Demand Responsive Transit. A possible improvement is the dispatching algorithm, which is now a simple greedy algorithm using a first come, first serve principle. More advanced (optimization) algorithms for solving the Dial A Ride Problem could lead to lower waiting times for DRT, or a system optimum situation where for instance vehicle kilometers travelled are minimized.
Macroscopic transport models compute destination choice, mode choice, route choice and resulting network flows. These models are typically on an aggregated level, which means vehicles are aggregated and described as continuum. No individual trips or departure times are modelled.
Now the attractiveness of the DRT service is modelled using an ‘Alternative Specific Constant’ (ASC) representing the user acceptance rate. However, the actual acceptance largely depends on the exact design of the service, which is currently not included in the model. The user acceptance is now considered an input rather than a result of the chosen design of the service. In a future implementation, this could be improved upon.
Furthermore, studying more case studies will give more insights into the expected effects of DRT in different contexts. For instance in a highly urban city center, or in a rural area where DRT can be used to replace or complement the scarcity of public transport connections. More knowledge on performance and (un)desired effects of DRT systems in different contexts can help transport planners in designing a future-proof system.
7 Conclusions
In this report, a framework is presented which enables modelling of new modes with constrained vehicle availability such as Demand Responsive Transit in macroscopic transport models, including mode choice. In literature, the modelling of DRT used to only be possible in complex microscopic models, and has not yet been connected to more advanced mode choice models. In the proposed framework, aggregated OD matrices of passengers that would like to travel using DRT are disaggregated to individual trip requests at a more precise timeslot using a departure time profile. A vehicle dispatcher then assigns DRT vehicles to the passenger requests. All vehicle trips (including the empty trips with no passenger on board between the previous drop-off and next pick-up) are aggregated into an OD matrix of vehicles. The vehicle trips are assigned to the network, and resulting network travel times are used in a next iteration of the mode choice module. This loop is repeated until a stable situation is achieved (equilibrium).
The results for Eindhoven provide insights into the operational features of a future DRT system. It is shown that DRT competes not only with private car, but also with the existing traditional public transport and bike. An increasing DRT fleet size increases the DRT mode share, but at the cost of public transport and bike. The vehicle kilometers travelled increases with an increasing fleet size, compared to the base situation where no DRT vehicles are deployed. As a result, more congestion will occur on the network, being evident by the vehicle loss hours. The desired level of service, pricing, and fleet size and resulting mode split and congestion levels can also be investigated using the proposed modelling framework. The scenarios studied show that the price of DRT has a substantial impact on the usage of the service. Whether DRT receives green priority at the intersections does not show significant influence on the usage of DRT or resulting vehicle kilometers travelled by DRT vehicles. The implemented methodology allows governments to make deliberate decisions concerning the introduction of DRT in their cities and regions.
References
- Lohman, W., Cornelissen, H., Borst, J., Klerkx, R., Araghi, Y. & Walraven, E. (2023). Building digital twins of cities using the Inter Model Broker framework. Future Generation Computer Systems. (under review).
- Borst, J. (2010). Urban Strategy: Interactive spatial planning for sustainable cities. Next generation infrastructure systems for eco-cities (pp. 1-5). IEEE.
- Snelder, M., Wilmink, I., van der Gun, J., Bergveld, H. J., Hoseini, P., & van Arem, B. (2019). Mobility impacts of automated driving and shared mobility. European Journal of Transport and Infrastructure Research, 19(4).