SALZBURG
Simulating Automated Mobility

1 Scope
One of the sites of the Austrian Triple Mega site the Salzburg mega site aims to enable and support public transport into the city. The demo includes an automated DRT (demand-responsive transport) for a peri-urban region, connecting it to the city centre via an intermodal mobility exchange, bridging the first/last mile using automated shuttles. A city-wide simulation is run to evaluate the impact of such DRT-services on modal split of the served areas as well as the effect of DRT on public transit lines in the area and connecting lines into the city.
1.1 Pilot description
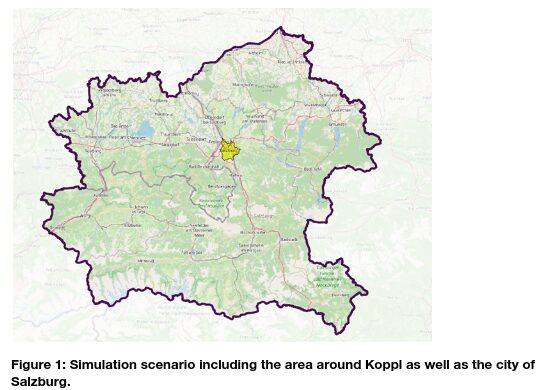
For the Salzburg Site, a mesoscopic simulation was set in MATSim. The MATSim model for DOMINO Salzburg includes the city of Salzburg, large parts of the state of Salzburg, the German Corner (road network only) and small parts of Upper Austria (see Figure 61). From the national transport survey of Austria, Österreich Unterwegs 2013/14, a population was created that includes socio-demographic characteristics as well as the activity chain of the individuals. Currently, a population with around 33% of the total mobile population is simulated. The modes of transport available in the MATSim model are walking, cycling, public transport and car. In addition, the automated shuttle running in Koppl is simulated and, for more advanced scenarios, a DRT service in the current region around Koppl that picks up passengers at the stops of the automated shuttle.
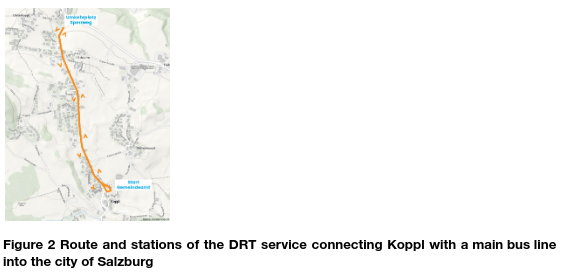
In the pilot, a fixed route will be served by an autonomous DRT service that will travel with a top speed of 50 km/h.
1.2 Simulation Network
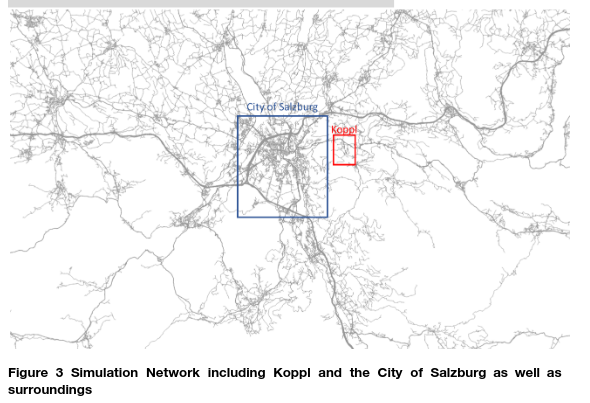
The study network for the MATSim simulation contains the network of the shuttle area of Koppl but also the network of the city of Salzburg and the surrounding regions. The Network was extracted from OpenStreetmap
1.3 Simulation parameters
Next to basic assumptions, like the maximal speed of DRT Shuttles (50 km/h) the main set of parameters for the simulation of automated shuttles in a MATSim simulation are the mode-choice parameters.
An important parameter for the simulation is to set the attraction of the new shuttle service. Since there have been no SP surveys conducted in the simulation area, we refer to literature. In line with several studies, we assume that the VTTS associated with riding a shared automated electric vehicles is similar to the VTTS of car passenger: whereas Lu et al. (2018) [6] found no differences in the VTTS between drivers and passengers of a car, Fosgerau (2019) [1] and Ho et al. (2015) [4] come to the conclusion that the VTTS for a passenger can be regarded as about 75% of the rate for car drivers. We follow in our model these latter findings. Since the VTTS of pt is about 50% of the VTTS of cars in our mode choice model, the VTTS of the new drt service is around 150% of the VTTS of pt.
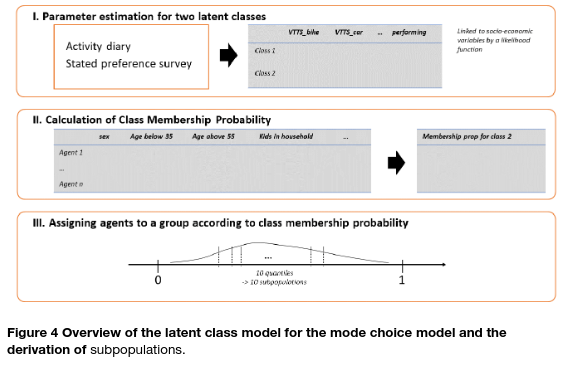
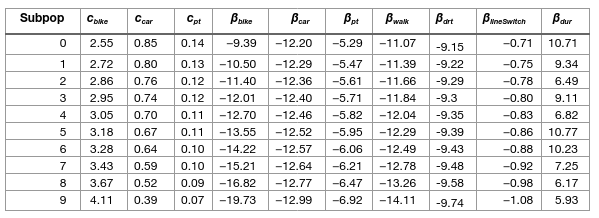
Parameters for the mode choice model for the DRT vehicles follow the approach described in Müller et al. (2021) [7]. A Latent Class Mode Choice model (LCMCM) is estimated on data containing weekly activity diaries and expenditure data from a representative sample in Austria (see Hössinger et al 2020 [6]). The variables deciding on class membership in the LCMCM are gender, age under 35, age over 55, income higher than the median, schooling higher than the median, living in an urban area, children in the household, single household, and working full-time at least 38 h per week. Since MATSim does not allow for agent specific models, the LCMCM is used to separate the population into 10 subpopulations of equal size and the parameters for these groups are calculated by averaging over the parameters of the subgroup members.
The parameters are all listed in detail in Table 1. More specifically, the mode-specific constants, the value of travel time savings (VTTS), and the value of leisure are (VoL), and the disutility associated with transferring public transport vary across subpopulations are used as parameters in MATSim.
Table 1 Parameters from the choice model to calculate the subpopulations’ parameters for the Charypar-Nagel function (Axhausen et al., 2016) [8]. C_mode refers to the not yet calibrated constants, βmode to the value of travel time savings (VTTS), here noted as disutility, and β_dur indicates the value of leisure.
The cost of owning and driving a car follows estimates from ADAC [2] for average vehicles. The fixed cost of a car is assumed to be 13.521 EUR per day excluding an additional expenditure of 0.091 EUR per kilometer driven. These costs are implemented y the parameters daily Monetary Constant and monetary Distance Rate. Bicycle costs are estimated to be 1 EUR per day [3]. Public transportation travel costs for agents without a concession card or an annual ticket card are manually configured by taking the average of station-to-station fares. All financial expenditures are direct disutilities in the utility function in case the mode has been used at least once.
1.4 Simulation scenarios
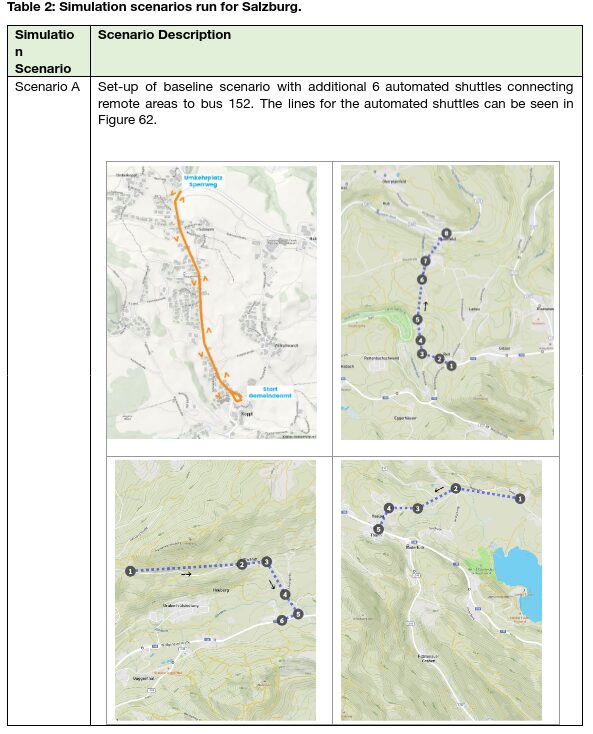
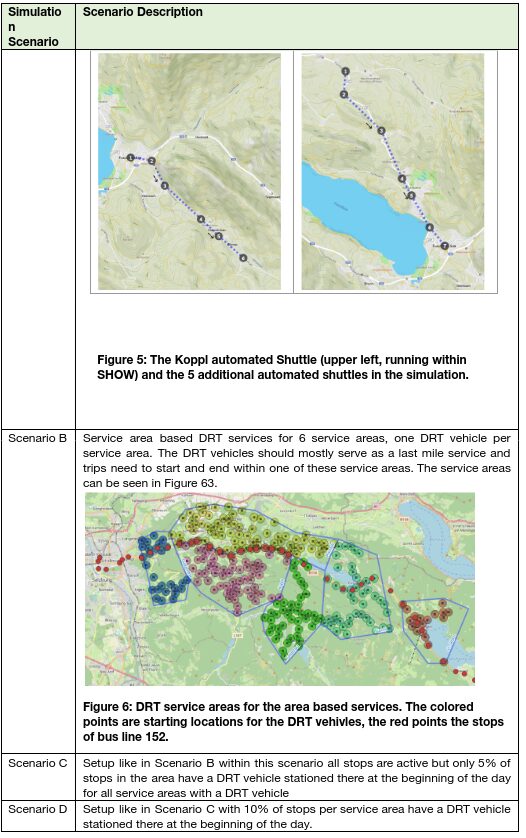
Several scenarios were simulated. The first scenario used for calibration of the model is a baseline scenario that does not include the automated shuttles. This scenario is applied to calibrate the MATSim model to the modal split in the region and serves as a comparison for the other scenarios that include a variety of automated options. The first is just route based automated shuttles like the ones run in many of the SHOW sites. This is compared to different Scenarios with different numbers of Shuttles in six operating areas. The operating areas were chosen, such that remote regions would be connected to the main road and major bus lines running there with a interval time-table. It was decided, that DRT were just allowed to run within their areas rather than connecting the areas, to avoid that DRT vehicles would not take travellers from conventional bus lines. Also it avoids that DRT concentrate in one area.
In addition the following scenarios were run:

2. Tools
A mesoscopic city wide simulation was conducted in MATSim. MATSIm is an open source simulation software offering rich potential to model the effect of different measures on transport but also on different groups of citizens. Furthermore, MATSim is an open-source platform, which means it benefits from a vibrant and collaborative community of developers and users.
MATSim is agent-based, meaning it models individual travellers and their decision-making processes using a mode choice model on predetermined agent plans. This approach allows for a detailed representation of travel behaviour, capturing the complexity of interactions among individuals and their choices. This is made possible by the synthesized population including agents plans but also socio-demographic features.
One of the key strengths of MATSim lies in its ability to handle large-scale scenarios, making it suitable for analyzing entire cities or even regions. This makes it possible to assess the impacts of different transport policies and infrastructure changes like the introduction of automated DRT.
Another advantage of MATSim is its versatility in analyzing different policy scenarios. The framework enables users to simulate and compare public transportation improvements like different implementations of automated DRT but can also use various other interventions, such as road pricing. By evaluating different scenarios, decision-makers can assess the effectiveness of policies, estimate their costs and benefits, and identify potential unintended consequences. This policy sensitivity analysis can inform the design of more sustainable and efficient transportation systems.
3 Key Inputs and Outputs
3.1 Data used
The car and DRT routing graph for the simulation region is based on the map provided by the OpenStreetMap. For public transport, information from a General Transit Feed Specification file is used. This GTFS-file is also adapted for the scenario that includes the automated shuttles on their fixed routes for scenario 1. The time-table was designed such that the shuttle would reach the main bus line in time to drop off and pick up passengers.
Initial daily schedules of the simulated mobility population will be created by cleaning, geo-constraining and resampling data of the Austrian national mobility-survey Österreich unterweg for the described region.
The agents will be assigned potential activity locations based on land use categories and points of interest (both derived from OpenStreetMap) as well as open data for population density and workforce. The open source tool ARUP PAM [9] was adapeted for the use on Austrian survey data.
Since MATSim’s internal default router is not well designed for multi-modal routing, the AIT intermodal routing framework Ariadne [10] will be integrated in the iterative replanning of trips in the simulation.
3.2 Extracted KPIs
The Simulation was carried out in MATSim. Several KPIs were calculated from the simulation results. The KPIs are from the areas of societal and traffic, energy and environment. Many other KPIs could be extracted from the simulation including changes in emissions (e.g. noise and air pollutants). The definition of the plotted measurements along with the corresponding related KPI follow:
Societal
- Empty vehicle km
- Shared Mobility Rate
Traffic, Energy, Environment
- Kilometre s travelled
- Modal split
4 Followed Models
No particular microscopic models are used for the automated DRT. The mode choice model is described in section 2 in detail. For the assignment of DRT vehicles to agents, the MATSim DRT Module was applied, which contains a matching algorithm described in Bischoff et Al. 2017 [11].
5 Results
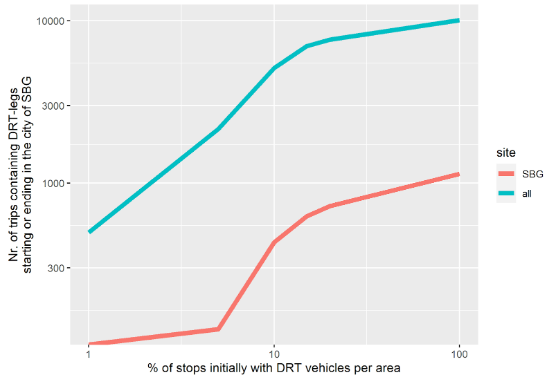
Results about modal split changes (KPI B20) Scenarios B-F show are a progression of scenarios with a growing number of DRT vehicles in each area. In Scenarios B there is just one vehicle in each area. In Scenarios C-E the number of DRT stops stays the same, but there is a growing percentage of stations initially equipped with a DRT vehicle at the beginning of the simulation, ranging from 5% of stations in each area to 20% of stations in each area. Finally in scenario F all stations are initially equipped with a DRT vehicle at the start of the simulation. The idea of these scenarios is to see limits in the uptake of DRTs with a growing saturation of DRT vehicles in the area. This helps to see the overall potential of introducing DRT services in a rural setting without adding push measures to limit car commuting into the city of Salzburg. In Figure 64 one can see that for all areas, the number of DRT trips is rising with the saturation in DRT vehicles. Once running the simulation agents switch between different modes, trying to optimise their daily mobility plans until an equilibrium is reached and agents do not change their modes or routes any longer. Comparing the different scenarios, one can see that the largest modal shifts come with higher numbers of DRT vehicles. In addition, one can also see in Figure 67 that these variation trips from all modes are replaced by the DRT service with the largest switches from car to DRT vehicles. The largest switches come from car and walking trips.
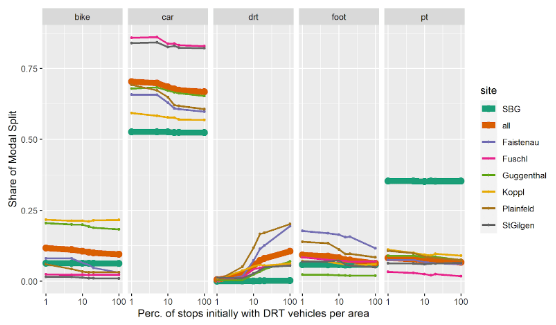
While there is a sizeable number of DRT trips starting or ending in the different DRT areas, not surprisingly of the trips starting or ending in the city of Salzburg the share of trips containing a DRT leg is very small. Since the trips would need to start or end in the DRT areas east of Salzburg, this is not surprising. However, Figure 65 shows that even the absolute number of trips containing a DRT leg starting or ending in Salzburg is quite small compared to the number of trips containing a DRT leg starting or ending in one of the DRT areas. This suggests that the trips replaced with trips including DRT legs happens rather for shorter trips, where the replacement trips have only a small number or no changes, i.e., trips within the DRT areas are replaced by trips taken completely in the DRT service. This is partly due to the relatively hard penalty for waiting times at public transit stops which has 1.77 times the disutility of travelling by PT and an additional penalty for switching pt line which is about 15% of the VTT of PT. If there are no other changes to the transport system making car travel less attractive it is hard to convince travellers to switch form a faster mode (car) to a slower one with changeovers, even though travel time is penalised less for pt than for car journeys in the mode choice model within MATSim. Considering, that the total number of about 1000 trips added to the public transport and DRT modes, and these trips will be mostly served by the bus line 152 this is a significant addition to the number of passengers of this bus.
Looking at the modal shifts in Scenario F where we all stations have a DRT vehicle stationed there at the beginning of the simulation, one can see that DRT substitutes all modes almost equally. Out of the around 6250 trips shifted compared to the base scenario, from which 5353 have been shifted towards DRT trips. 34.0% of these DRT trips have been done in the base scenario by car, 30.7 % by foot, 19.4 % by bike, and 15.9 % by public transport.

Results about shared mobility rates and vehicle utilisation (KPIs B30 and B31): The agent-based simulation allows precise information about the shuttle vehicle usage because their implementation in the simulation comes with an optimization algorithm. This dynamic vehicle routing problem (dvrp) module matches agents that want to go from one region to another at about the same time. These regions are defined in our case as the DRT zones, but could also be set to a grid with a given edge length. The maximum waiting time for an agent is set to 10 minutes.
The output of the simulation runs provide detailed information on how the shuttle vehicles are used such as the passengers’ kilometers travelled and empty kilometers. These data allow the calculation of the occupancy rate of vehicles.
Table 14 provides details of the scenarios for the total distance traveled (in km), the total empty distance (in km), and the resulting share of kilometers traveled when the vehicle was empty.
The occupancy rate o refers to the occupancy of the DRT vehicles by distance travelled. It is defined as

It is apparent that the occupancy rate increases with the number of vehicles. Already with a provision of 5% vehicles (scenario C) at the stops, the occupancy rate is more than the estimated average occupancy rate in Austria (1.3). The higher occupancy rate in scenarios with more DRT vehicles might appear counter-intuitive, but results from the optimization algorithm. For finding matches of passengers, the MATSim dvrp module (dynamic vehicle routing problem) uses a grid with a configurable edge size (in all scenarios 400m) to determine the origin and destination cells for each agent that makes a request. Only agents with the same start and destination cell will be matched. If a ride with a passenger is ongoing, the destination cell of the agent that makes the request and the one that is already in the vehicle needs to be identical. It is preferred to match passengers instead of requesting a new, unoccupied vehicle for the ride. The increasing occupation rate tells that in scenarios with a small vehicle fleet that there are not enough rides to match agents but instead a new vehicle will be taken.
As a result, the stop based system results in a comparably high mean occupancy rate of almost 2 passengers (1.97, not mentioned in the table) per shuttle vehicle. In the same way the occupancy rate increases, the empty ratio decreases with the number of shuttle vehicles. The minimum of around 16.5% is reached for one vehicle per stop and is assumed to not decrease much further with a higher provision of vehicles.
Table 14: Automated vehicle distances, empty ratios and occupancy rates of the DRT vehicles in the Scenarios.
| Total_distance_km | Total_empty_km | Empty_ratio | Occupancy rate | |
| Scenario B | 576.26 | 243.97 | 0.350000 | 1.028333 |
| Scenario C | 2381.66 | 1034.17 | 0.411667 | 1.356667 |
| Scenario D | 5215.16 | 2126.41 | 0.37666 | 1.468333 |
| Scenario E | 6573.19 | 2543.43 | 0.348333 | 1.486667 |
| Scenario F | 6778.34 | 2507.97 | 0.330000 | 1.481667 |
| Scenario G | 6423.80 | 1323.05 | 0.165000 | 1.548333 |
Since no economic variables for the implementation and operation of automated DRT services, no cost-benefit analysis is possible at this stage. However, in Figure 65 and Table 14 it can be seen, that the rise in benefits from the number of automated DRT vehicles is diminishing with a growing number of vehicles. While there is a sharp rise in the number of DRT trips and the occupancy rate of DRT vehicles up to a number of vehicles corresponding to 10% of the number of DRT stops in an area. Afterwards the rise in gains drops quickly. Hence, the optimal number of vehicles can be estimated around to be around this number when it comes to changes in modal split and occupancy rates of vehicles compared to the expected costs.
6 Strengths and Limitations
The usage of a city wide MATSim simulation has several strengths:
- Traffic simulation, as a robust approach, enabled testing of new mobility technologies and examining the impacts of alternatives before real-life interventions such as the present case studies including the introduction of automated driving services.
- Due to the detailed integration of mode-choice models and a detailed realistic agent population, overall results can shed light on expected uptake of automated options past the small trials that can be conducted in real world experiments.
- In addition to an added number of vehicles, other future options, like less restrictive rules (e.g. higher speed) for automated vehicles can be tested.
- Effects but also rebound effects like the switch from active modes to automated DRT can be shown using city wide models. This allows to study additional push measures to limit agents to a more enviromnemtally sound behaviour.
On the contrary, the present research does have certain limitations:
- City wide simulations cannot produce an insight on street level behavioural impacts of automated vehicles, since detailed driving models would make simulations too time consuming. Hence, easy queueing models are applied in MATSim.
- Public transit is currently not simulated in the street network but operated along time table information. This might result in favourable results for PT uptake if there are no separated road spaces for public transport.
7 Conclusions
The DRT shuttles add non-motorized accessibility to rural areas, giving people the chance to reach the city without using cars. This can be seen in the rise in bus trips on the main bus line, especially for scenarios with many DRT vehicles.
The result revealed that without further push measures many of the trips taken in the shuttles are replacing shorter trips by bike or on foot. While there is also a drop in car journeys, the exact environmental effects of the DRT shuttles need to be investigated.
References
- ADAC. ADAC Autokosten. 2020. Available online: https://www.adac.de/infotestrat/autodatenbank/autokosten (accessed on 24 July 2020).
- DieEinsparBerater. Kosten-, Zeit- und Verbrauchsvergleich Verschiedener Fahrradtypen. 2020. Available online: http://www.dieeinsparinfos.de/guenstige-mobilitaet/fahrrad/kosten/uebersicht-energieverbrauch-und-kosten-beim-radfahren (accessed on 24 July 2020).
- Fosgerau, M. (2019). Automation and the value of time in passenger transport. International Transport Forum – ITF Discussion papers.
- Ho, C. Q., C. Mulley, Y. Shiftan, and D. A. Hensher (2015). Value of travel time savings for multiple occupant car: evidence from a group-based modelling approach. In Australasian Transport Research Forum 2015 Proceedings.
- Hössinger, R.; Aschauer, F.; Jara-Díaz, S.; Jokubauskaite, S.; Schmid, B.; Peer, S.; Axhausen, K.; Gerike, R. A joint time-assignment and expenditure-allocation model: Value of leisure and value of time assigned to travel for specific population segments.Transportation 2020, 47, 1439–1475.
- Lu, H., C. Rohr, B. Patruni, S. Hess, and H. Paag (2018). Quantifying travellers’ willingness to pay for the Harbour Tunnel in Copenhagen: A stated choice study. MOE | Tetraplan.
- Müller, J., Straub, M., Richter, G., & Rudloff, C. (2021). Integration of different mobility behaviors and intermodal trips in matsim. Sustainability, 14(1), 428.
- W Axhausen, K., Horni, A., & Nagel, K. (2016). The multi-agent transport simulation MATSim (p. 618). Ubiquity Press.
- https://github.com/arup-group/pam, Population Activity Modeller (PAM), website accessed (20.05.2023)
- Prandtstetter, M., Straub, M., & Puchinger, J. (2013, November). On the way to a multi-modal energy-efficient route. In IECON 2013-39th Annual Conference of the IEEE Industrial Electronics Society (pp. 4779-4784). IEEE.
- Bischoff, Joschka, Michal Maciejewski, and Kai Nagel. “City-wide shared taxis: A simulation study in Berlin.” 2017 IEEE 20th international conference on intelligent transportation systems (ITSC). IEEE, 2017.