Graz
Simulating Automated Mobility
1 Scope
This document deals with the simulation activities related to the Graz Pilot Site. More precisely, street level simulations are presented here; VRU level simulations are presented in a separate document. Again, in a separate document, it can be read how both simulations have been combined in the context of the Graz pilot site.
1.1 Pilot description
The test site Graz has some challenging urban environments with bus stops and pedestrians, busses, and public traffic. A shopping mall and several independent stores are the surrounding of the test environment.
The key objectives of the Graz site are the following:
- Integrate automated and connected shuttles into existing mobility services
- Enable automated vehicles to enter highly frequented public transport bus stops
- Perform safe detection of pedestrians and shuttle passengers at bus stops
- Construction of an automated shuttle line demonstrator linked to a bus stop
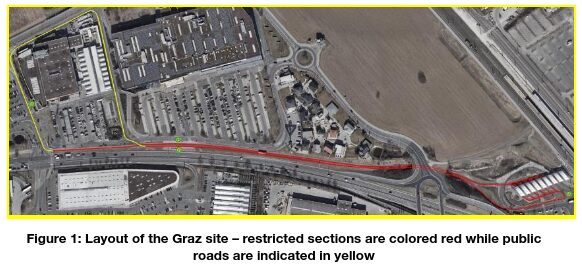
Our shuttle service, provided for SHOW project, connects the public transport hub Puntigam with the shopping center West. This testing environment (see Figure 1) is basically split in three major parts: (i) the train-, bus- and tram-stop (shown on the right), (ii) the bus-lane leading to the shopping center West and (iii) the roads within the shopping center (on the left side). Every section has its own challenges. The transport hub is served by six public bus lines, a tram line and it is also connected to an urban railway station (cp. Figure 2) and a small park-and-ride facility is also located in the immediate vicinity of the transport hub. Thus, many pedestrians roam around the area and cross the road in a very unstructured manner. The bus-lane connecting the transport hub with the shopping center is a restricted road section – only public busses are allowed to use it. Sporadically pedestrians walk on this road although they actually have a separate walkway. In the third section consists of a rather complex traffic layout within the shopping center with many lanes, curves and roundabouts and also high traffic volumes, especially during shopping hours.
The speed limit for driving is 30 km/h in those areas as the city of Graz has a general speed limit of 30 km/h excluding priority roads. An exception is the bus terminal, where a self-defined maximum speed of 10 km/h was chosen due to safety reasons and the larger number of pedestrians. On the whole route, the automated vehicle can encounter pedestrians and buses.
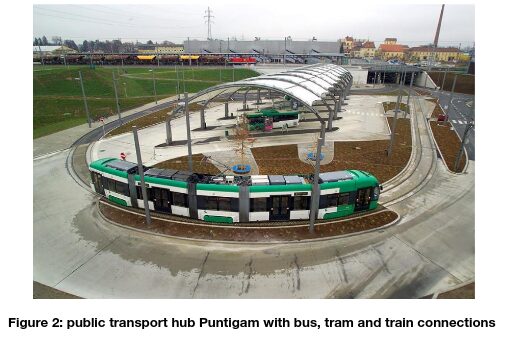
An essential task of the automated journey is to drive through the bus terminal. Here, it must be determined which bus bay is available, i.e. free of buses, and where few VRUs are at risk. For this reason, the bus terminal digital infrastructure must allow to detect presence of buses and acquire information of buses arriving soon. The bus terminal is monitored via a smart camera system. It detects the bounding boxes of the objects in its view, classifies them and provides corresponding information locally to the C-ITS Road Side Unit (RSU), which further sends out C-ITS messages to the vehicles. In addition, AVs need to cross a tram track after leaving and before entering the bus terminal. This information is also conveyed via C-ITS to the vehicles.
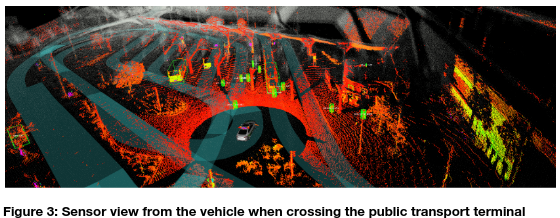
Figure 3 illustrates what the automated driving software actually sees, when it is in front of the public transport terminal. The red points are points from the Lidar point cloud showing the surface of the road and any other objects in the 3D space. The green cubes and cylinders are recognized objects like buses and pedestrians. The predefined lanes through the bus stop area are coloured in cyan.
1.2 Simulation Network
The road network for SUMO of the Graz pilot site includes the track for the SHOW shuttles and the relevant surrounding road network. In Figure 4 an OpenStreetMap visualization of the pilot site can be seen. A priority 4-lane road B67a in west-east alignment essentially divides the map into two parts. North of B67a is the Shopping Center West – our destination. In the south there are further, large shops. At its western end, B67a connects to a highway on-ramp. Eastward this road leads either toward the city center or toward the airport. In addition, various other businesses and restaurants are connected to this road toward the east. A single intersection connects the shopping center to road B67a (left side of Figure 4). Because of high traffic on B67a, the public transport busses have a separate, exclusive road between the bus terminal and the shopping center – which our shuttles are allowed to use. At the western end of the bus lane, an intelligent traffic light is installed which gives priority to traffic on the bus lane.
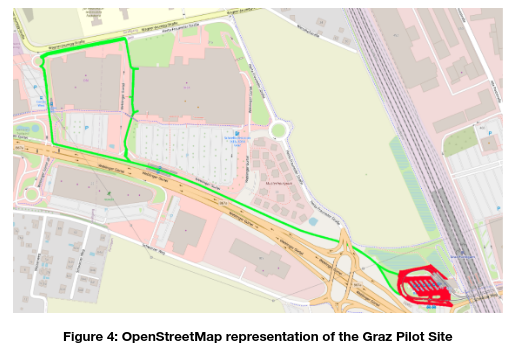
Highlighted in green and red are the roads used by the automated shuttles. The green road segments to and within the shopping center are modelled and simulated using SUMO. The roads and walkways within the bus terminal are painted in red. This is the part of the track, where the lane-based simulation of SUMO in not adequate to handle the pedestrians roaming around in various directions. Here the simulator of Autoware is used because a lower level of abstraction is needed. Within the Autoware simulator, static obstacles and moving objects can be placed. Based on this 3D scene, sensor data like Lidar point- are generated. By using the processing pipeline and algorithms of the real automated shuttle, the gap between simulation and real world is kept low.
While the Autoware simulation is as close to reality as one can get, there are two major downsides: Firstly, the entire scene and all traffic participants must be modelled – a huge effort for a large track. Secondly, because of the complexity and simulation details, a simulation run takes potentially a long time to finish.
Therefore, the major part of the track is simulated in SUMO to determine the required KPIs. Only in the area of the bus terminal the detailed Autoware simulation is used, where VRUs can be handled better.
1.2.1 Simulation network in SUMO
Based on this OpenStreetMap, a simplified SUMO map is created by removing several insignificant roads and intersections manually. The remaining simplified map has still 282 road segments and 144 junctions (cp. Figure 5). Roads that are not logically connected (upper right) to the pilot site are eliminated. Minor roads within the shopping center that are not relevant for the pilot site (bottom) are reduced as well. The complex road network within the bus terminal is simplified significantly for SUMO by reducing the entire place to a simple connection lane.
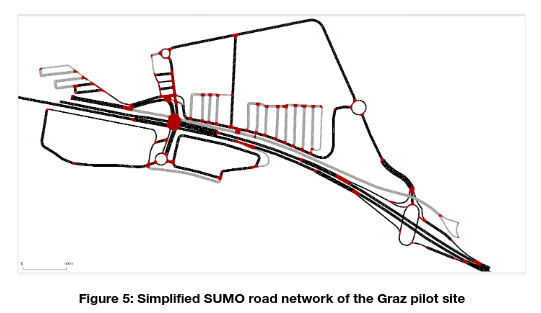
The main goal of the SUMO simulations is the generation of a realistic traffic load around the pilot site area for the automated shuttle to interact with. With a few assumptions about the intentions of drivers, it is relatively straightforward to generate reasonable traffic using SUMO: Most of the traffic on B67a is passing through from east to west and vice versa. A small fraction of the traffic enters the shopping mall, both north and south. Likewise, the parking lots and underground garages within the shopping center can be seen as a source of traffic. The majority of vehicles starting their journey there want to leave the shopping center using the road B67a. Some traffic is potentially coming from and going to the north using Herta-Frauneder street. Very important for the traffic simulation is bus line 65, which is using partially the same restricted roads as our shuttle service.
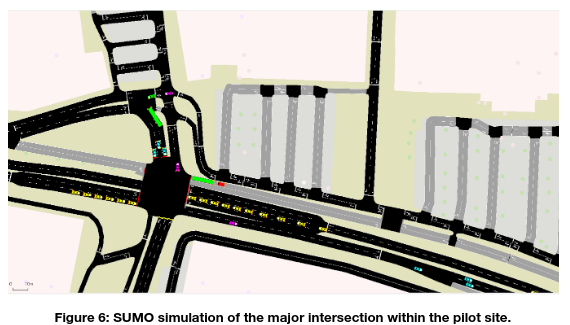
A snapshot of the running SUMO simulation can be seen in Figure 6. For easier debugging purposes, different routes are using different vehicle colours. Red is reserved for the Show shuttle. Yellow vehicles are driving along the B67a, not really interacting with the shuttles path. Green vehicles are starting on the B67a and pass through the shopping center. Pink vehicles originate in the southern shopping center, cyan vehicles in the northern shopping center. 90% of the pink and cyan vehicles exit the scene using B67a, while 10% change between northern and southern shopping center. Busses of the public transport service are green too. Since they share the same restricted road, they have the most influence on the behaviour of the Show shuttle.
1.2.2 Simulation network in Autoware
With the Autoware simulator road level simulations can be done, sensor data can be provided, and the vehicle dynamics are modelled. The algorithm development, especially to handle the bus terminal with the different bus lanes and VRUs is done in with the Autoware simulator the SHOW project.
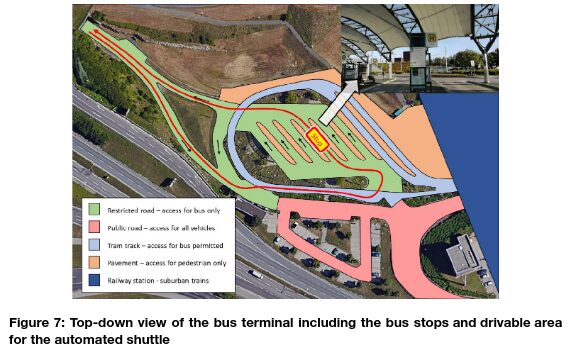
The main focus at the bus terminal is to handle any kind of situations with VRUs and how to choose the correct bus lane to pass during a ride. Each ride the automated shuttle must choose the correct bus lane (see Figure 7) when it passes the bus terminal. Therefore, a simulation environment is needed which can be used for this as well to simulate pedestrians. In both cases sensor data is needed to develop and evaluate the complete autonomous driving software. With SUMO this cannot be done, because no sensor data can be provided to simulate the complete autonomous driving software.
To fulfil the requirements for the automated driving functionality the automated shuttle needs to have a detailed information about the road network. The used autonomous driving stack relies on a high-definition map including all relevant information for driving and all lane markings as well must be precise stored in the map. Figure 8 shows the 3D point cloud in grey used for the localisation and in colour the road network used for perception and planning in the autonomous driving stack.
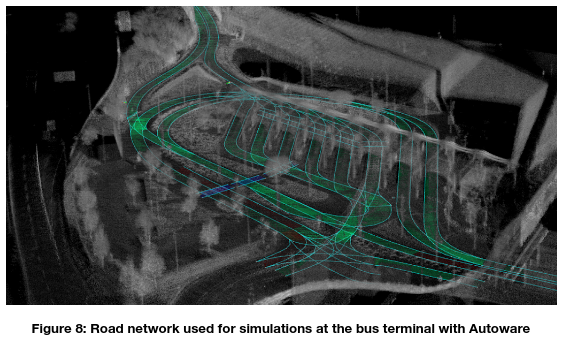
Beside the autonomous driving stack running in the automated shuttle or in simulation, the road network is also used by the Autoware simulator to simulate other traffic participants. More details about the generation of the road network can be found in chapter 3.1.2 and the usage of other traffic participants in chapter 3.1.4.
1.3 Simulation parameters
Simulation parameters and their variation at random in specified ranges is often used to generate various simulations from a single scenario.
1.3.1 Simulation parameters for SUMO
Since SUMO is used to simulate the manually driven vehicles around the pilot site to analyse the interaction with the shuttle and to obtain some requested KPIs, the default values are used if not specified otherwise.
| vehicle type | max.velocity | max.accel | max.brake | follow model |
| normal car | 40 km/h | 2.6 m/s2 | – | – |
| sporty car | 60 km/h | 2.6 ms/2 | 4.5 m/s2 | – |
| coach | 40 km/h | 1.0 m/s2 | 3.5 m/s2 | – |
| shuttle | 35 km/h | 0.5 m/s2 | 2.5 m/s2 | IDM |
Table 1: Vehicle parameters used for SUMO
Subsequently, the simulation time step is set to 0.1 seconds and the duration of a simulation run is set to 650 seconds. This turned out to be sufficient for the shuttle to complete a journey from the bus terminal to the shopping center and back again with a delayed start of 60 seconds. Delaying the departure time ensures that the shuttle has to integrate into the traffic that is already flowing.
1.4 Simulation scenarios
The goal of the pilot suite supporting simulation activities are mainly to test, compare and optimize algorithms – especially in the area of the bus terminal. Another goal was the determination of plausible conditions for the test drives, such as an estimation of min/max lap time – without passenger interactions.
1.4.1 Simulation scenario for SUMO
Unlike other pilot sites, it is not essential to investigate the impact of shuttles on existing traffic in Graz. On one hand, there are only two shuttles in Graz. And on the other hand, the shuttles are on separate bus lanes most of the time, where they cannot slow down traffic. Since the shuttles travel most of their route at the maximum permitted speed of 30 km/h, it is also unlikely that city buses are hindered.
Therefore, the simulations done with in SUMO’s are mainly used to determine several KPIs, such as lap-times and the influence of various factors, such as vehicle speed, on them, under different traffic conditions.
1.4.2 Simulation scenario for Autoware
VRUs
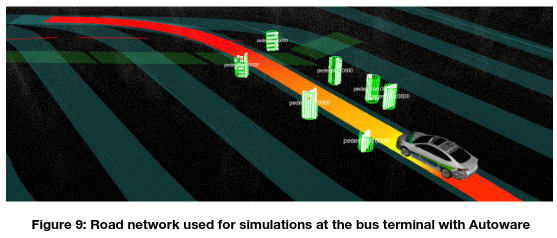
Handling situations with pedestrians is crucial for an automated shuttle, especially at the bus terminal where many VRUs walking around in any kind of directions and also distracted by different things. Therefore, we test in simulation different situations with crossing pedestrian and investigate the behaviour of the system. Figure 9 visualizes an example where a pedestrian crosses the road in front of the vehicle. If a part of the trajectory is red, this means at this part the velocity is zero and the vehicle stops.
Bus lane selection
To avoid any kind of blocking of other buses and as well to find a fast way through the bus terminal it is important to develop and test the behaviour of the system. With the SUMO simulator this is not possible, based on the missing sensor data from the simulator which is needed for testing and evaluation.
Road Network
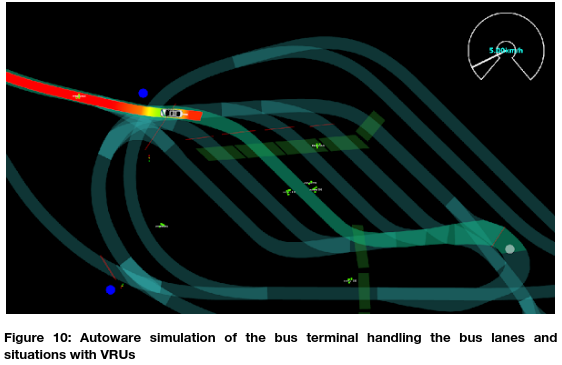
Before the automated shuttle drives on the real road, it is essential that also the traffic rules must be correct considered, e.g. all stop lines, speed limits and the correct usage of the lanes must be tested. Therefore, also the Autoware simulator is used in our simulation suite, see Figure 10 where the automated shuttle handles the road network and defined traffic signs.
2 Tools
SUMO (Simulation of Urban MObility) is an open source, microscopic and continuous multi-modal traffic simulation package designed to handle large networks. It can be used for various purposes such as testing traffic management strategies, studying vehicle communication, evaluating the impact of automated vehicles and more. Some of its advantages are, that it can be enhanced with custom models. It provides various APIs to remotely control the simulation, and it supports different types of vehicles and modes of transport. It can run on Linux, Windows, and Mac OS.
There are various ways to extend SUMO, such as adding new models, algorithms, or applications. Probably the easiest way to extend SUMO is by using TraCI (Traffic Control Interface), which allows remote control of running simulations. Various purposes such as changing traffic lights, rerouting vehicles, adding new vehicles, or retrieving information about the simulation state are supported using TraCI. While the native TraCI implementation is based on C++, different programming languages such as Python, Java or MATLAB can be used as well.
SUMO can visualize various aspects of the traffic simulation, such as vehicle positions, speeds, emissions, network elements, traffic lights, detectors, and more. There are different views. The 2D view is the default view, that shows the network and the vehicles from a top-down perspective. An experimental OSG view, that uses OpenSceneGraph to render the network and the vehicles in 3D with more realistic graphics, can be enabled through command-line parameters.
To get results from the simulation, output options that are of interest need to be enabled. SUMO allows to generate a large number of different measures, such as vehicle positions, speeds, emissions, routes, trip information, traffic lights cycles and more. All these outputs are written into XML files. Several tools are already available to get the data from the output files. For example, xml2csv.py can be used to convert any XML output file to a CSV file, that can be opened and further processed and visualized using MS Excel. E.g, the average speed of a vehicle on a certain road segment can be calculated by dividing the total distance travelled by the total time spent on that segment.
Autoware is the world’s leading open-source software project for autonomous driving. Autoware is built on Robot Operating System (ROS) and enables commercial deployment of autonomous driving in a broad range of vehicles and applications. With the Autoware simulator, a simulator for Autoware development and testing is available. To simulate components such as the vehicle dynamics, sensors and the environment different modules are available.
Various aspects of autonomous driving can be simulated with Autoware simulator, like lidar sensors or the perception algorithms such as object detection, tracking and classification. Furthermore, planning algorithms such as global planner, local planner and behavior planner can be tested on virtual intersections or in parking spaces. On a lower abstraction level it is even feasible to simulate different vehicle models and dynamics such as steering angle, throttle, brake, etc. and test the control algorithms.
For realistic simulation several things are needed. Most important, a map file that defines the road network and the traffic rules – OpenDRIVE and Lanelet2 format are accepted. Based on this map, a scenario must be created (OpenSCENARIO format or SUMO format are acceptable) that defines the initial positions and trajectories of the vehicles and pedestrians. Furthermore, a vehicle model that defines the appearance and dynamics of the ego vehicle is needed.
It should also be mentioned that the simulation tools described are used to test and evaluate specific issues related to the requirements of the SHOW project. VIRTUAL VEHICLE also uses other tools and simulators for the development and simulation of the autonomous driving software used at the automated shuttle.
3 Key Inputs and Outputs
3.1 Data used
In order to perform traffic simulations with any simulator in any meaningful way, the most important input is always a map of the area. The more details are included in this map, the better the simulation will be. In other words, if the map does not take into account a detail, the simulation cannot take it into account as well. Unfortunately, different simulators use different map formats. On the one hand, this is understandable, because each simulator has special properties and special requirements for the maps. However, this also means that there is not one map format that is suitable for all simulators, but a variety of incompatible map formats.
Apart from the map, the definition of traffic is the second important input variable of traffic simulations. Again, the definition of traffic is very dependent on the simulation tool and level of abstraction used.
3.1.1 Creating maps for SUMO
Maps for SUMO are stored in a SUMO specific file format, based on XML. Creating SUMO maps for any given area using the supplied map editor NetEdit is possible but a very slow, error-prone and painful process. Fortunately, SUMO provides a tool (osmWebWizard.py) which permits the generation of SUMO maps based on OpenStreetMap information (see Figure 7). Using this tool, it is possible to get a SUMO map quickly for a real track – provided the area is charted in OpenStreetMap.
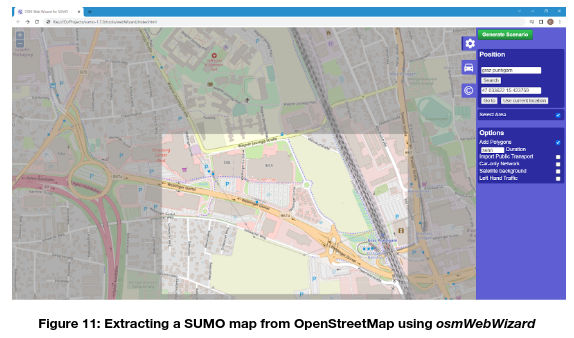
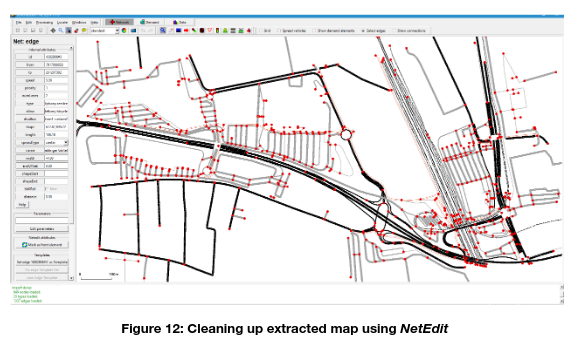
As the extracted map is always rectangular, it may happen that roads outside the test area are also included. If this is not wanted, or if it is even disturbing, it is possible to clean up the map afterwards using NetEdit – as shown in Figure 8.
In case of the Graz Pilot Site, the bus lane is defined as restricted road after the extraction. By default, this prevents busses using it. To overcome this difficulty, it is either necessary to define a vehicle class that is allowed on restricted roads, or simply remove the restricted road flag from the exported map.
3.1.2 Creating maps for Autoware
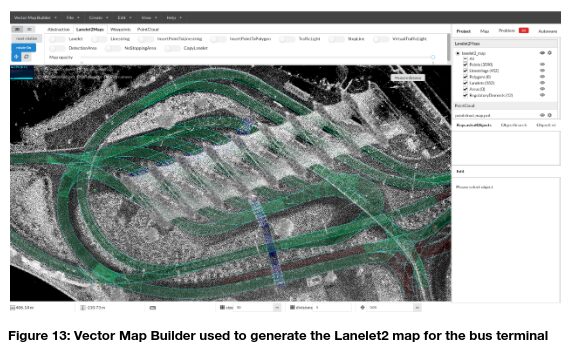
Autoware uses the map format Lanelet2 for automated driving functionalities. Lanelet2 is similar to OpenDRIVE, converters between these data formats are available. Different ways are possible to generate this map format, this depends mainly which data is already available and is the data accurate enough for the needed driving area. Since the map data is not only used for simulation, but also used for automated driving with the demonstrator, the map needs to be accurate enough to fulfill the requirements for the automated driving tasks. In our case we require an accuracy of the map below 10cm. Similar to SUMO, also Autoware can uses OpenStreetMap data, there are plugins available which can export a Lanelet2 data format. In our case we have the issue, that the area around the bus terminal is not sufficient mapped. All driving lanes are available, but the positions of e.g. the lane borders is not accurate enough. Therefore, we needed to generate the Lanelet2 by ourselves. The prerecorded pointcloud of the complete driving area was therefore used and with the VectorMapBuilder from Tier4 the map was created (see Figure 13). Using this tool, it is possible to get a map which includes following required details for automated driving: driving lanes, pedestrian crossings, stop lines, traffic lights and the speed limits.
3.1.3 Traffic definition for SUMO
Since SUMO was made for traffic simulations in the first place, the definition of traffic is comparatively easy. For every vehicle must be defined on which street/lane it should start from, where it should go to and what type of vehicle it is. SUMO is able to find a route from start to destination automatically. By specifying additional road sections that must be passed, it is possible to influence the route planning. This can go as far as specifying the complete sequence of roads a vehicle must use to reach its destination.
There are different ways to specify the frequency of vehicles in the SUMO traffic generation description. For trip definitions, the period attribute can be used to define how often a vehicle repeats its trip – well suited for busses with a regular schedule. The other possibility are traffic flow definitions. Here the traffic density can be set by specifying the number of vehicles generated in a given time interval. There are different ways to derive traffic flow definitions from real world data. Probably the obvious approach is to use traffic count data. SUMO provides several tools to generate traffic demand from such counting data. A more advanced method uses the density of homes and offices to generate realistic trip patterns from population statistics, such as the number of inhabitants, households, workplaces, schools, etc. in each district of the network. Finally, surveys, GPS traces, cellular data, etc. that provide information about the travel behavior and preferences of the users of the network can be used to derive traffic flows. SUMO does not have specific tools to handle these sources of data, but they can be used to calibrate or validate the traffic demand generated.
For the SHOW project an empirical method has been applied, using the a priori knowledge of the area, guessing the fraction of vehicles driving from and to the shopping center on a busy day.
3.1.4 Traffic definition for Autoware Simulator
In contrast to SUMO, Autoware Simulator is designed to be used to develop and evaluate the autonomous driving stack Autoware. The main focus thereby is the simulation of the vehicle interface and the simulation of other traffic participants. It is not designed for macro scopic simulations like SUMO.
Two ways are possible to define scenarios for other traffic participants. First, traffic participants can be placed manually via RVIZ (ROS visualization tool). This method is very simple to use but does not provide the possibility to simulate complex maneuvers. There it is possible to define object properties like the starting position, size, velocity, etc. The second method is to use a scenario configuration for automated testing, different behaviors of other traffic participants can be defined, and complex maneuvers simulated. The scenario description is similar to OpenSCENARIO. As example the start and end position can be defined, and the cars are driving depended on the road network.
With the Autoware Simulator can especially at the bus terminal complex maneuvers including sensor data can be simulated. With the provided sensor data (e.g. lidar data) the complete autonomous driving stack can be tested.
3.2 Extracted KPIs
The relevant KPIs of the Graz Pilot site are listed in Table 2. Several KPIs could be simulated using both simulators. In these cases, we have specified the simulator that allows easier or quicker determination of the desired KPI. Some KPIs can not determined by simulation at all (e.g. passenger exchange time) but need actual test drives with real passengers.
| KPI | Simulator | Comment |
| Collision avoidance | Autoware Simulator | Velocity reduction |
| Conflicts with VRUs | Autoware Simulator | Velocity reduction |
| Time headway | SUMO | distance headway divided by the own vehicle’s speed |
| Proportion of stopping | SUMO | waitingTime in tripinfo.xml |
| Manual take-over count | – | pilot test drives |
| Hard breaking | SUMO | extracted from shuttles speed profile, deceleration > 2 m/s² |
| Travel time | SUMO | duration – waitingTime |
| Distance | SUMO | routeLength in tripinfo.xml |
| Average speed | SUMO | routeLength / duration |
| Duration and length of trips | SUMO | duration in tripinfo.xml |
| Low speed due to VRU | Autoware Simulator | velocity comparison between scenarios with and without pedestrians |
| User quality perception | – | acceptance survey |
| User trust | – | acceptance survey |
| User safety perception | – | acceptance survey |
| Perceived usefulness | – | acceptance survey |
| Passenger exchange times | – | pilot test drives |
| Average waiting times | SUMO | derived from jitter of duration |
Table 2: KPIs defined for the Graz Pilot Site
The KPI manual take-over count requires further explanation: Basically, a manual takeover is required when the vehicle is operated outside the assumed or defined limits. This happens due to completely unpredictable events, which cannot be represented in the simulation in advance.
4 Followed Models
With the exception of the Show shuttle, all vehicles use the default follow model of SUMO, which is very simple: They apply their maximum acceleration if the road ahead is free until their maximum velocity is reached. And they brake with their maximal braking deceleration if there is an obstacle ahead. Thus, the resulting speed profile does not look realistic at all. However, if there are several hundred vehicles in a simulation, it is sufficient for a coarse approximation and very quick to simulate.
In contrast, a more realistic simulation is used for the shuttle. It is configured as electric vehicle and a different follow model “IDM” is chosen. Contrary to what the designation suggests, the follow model has a great influence on the acceleration behaviour of the vehicle, even on an empty road. The following parameters are set for the shuttle:
vehicle mass: 1600 kg
air drag coefficient: 0.6
maximum power: 1000 W
Of course the real shuttles have more than 1 kW peak power, but setting the power deliberately low guarantees a smooth acceleration and helps saving energy.
Other model characteristics, such as lane change behaviour, do not really matter in this particular case, because there is only one lane for the respective direction and overtaking is not intended. Route planning is also not relevant, as the shuttle follows the exact course set – approved by the Ministry of Transport – with no possibility of taking alternate routes or shortcuts.
For the purpose of influencing the shuttle and to retrieve its data at any time, a small TraCI project was created. With this project, it is easy to influence the shuttle and to program special characteristics. Currently TraCI is only used to realize a handover between SUMO and Autoware Simulator (see Simulation Suite: Connections between Simulation Levels) and to read out the velocity profile of the shuttle to detect significant braking manoeuvres.
5 Results
The simulations at the Graz pilot site have basically two objectives. On the one hand, the simulation should be used to investigate which travel- and waiting-times occur due to the traffic situation. On the other hand, the safe passage of the bus terminal – with many VRUs present – should also be ensured by means of simulations. In addition, an algorithm for estimating the availability of the bus bays was implemented based on the simulations, as replacement/supplement to the smart camera.
5.1 SUMO simulation results
When using SUMO, several logging files can be written during the simulation runs. Sometimes it can be challenging to extract the desired measurements from the large amount of data generated during simulation runs. For more complex cases, it is usually a good idea to program a small script that reads the XML files from SUMO
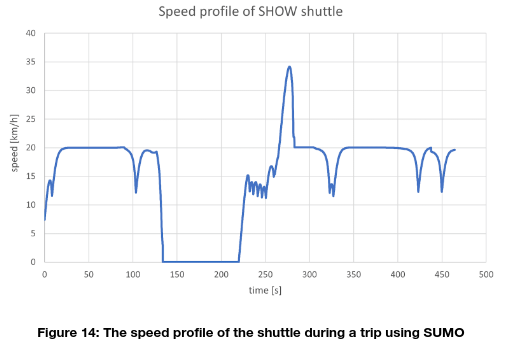
To gather the data presented for this chapter it was necessary to run SUMO a hundred times with different random number seeds and aggregate the results. The speed profile during such a simulation run can be seen in Figure 9. The shuttle enters the section of the track covered by SUMO simulation with a speed of approximately 7 km/h, coming from the bus terminal. It then proceeds along the bus lane toward the shopping center. At time 130 seconds the shuttle waits at the traffic light to turn green. After the traffic light the shuttle is on the public road inside the shopping center. Here the speed is fluctuating because of other traffic participants. At 270 seconds the vehicle has clear way inside the shopping center and accelerates to its max speed plus speeding factor before it enters the restricted bus lane again at around 300 seconds.
According to the definition of Table 2, the data of the one-hundred individual simulation runs were arranged and are presented as histograms in the following. First the distribution of the average speed, which is calculated by dividing the track length (~1.8 km) by the trip time. It can be seen that 16 km/h is the average speed during most simulation runs.
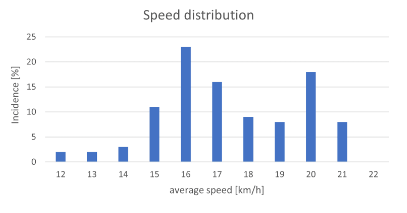
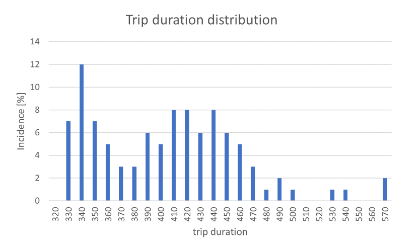
As already seen in the average speed histogram, the trip duration (Figure 11) has two peaks as well. The explanation for this is essentially the traffic light in the shopping center. Fortunately, if the light is green, a round trip takes about 340 seconds. On the other hand, if the shuttle is unlucky at the traffic light, the trip time is about 440 seconds. In rare cases (traffic jams, buses impede the shuttle at the traffic lights), trips of up to 570 seconds are possible.
SUMO also offers the possibility of a more sophisticated analysis, which other simulations or real driving tests cannot easily provide. Figure 12, for example, shows the pure travel time excluding the waiting time at the traffic lights, i.e. the temporal jitter that occurs solely as a result of other road users during a trip. Unlike the entire trip duration, this measurement
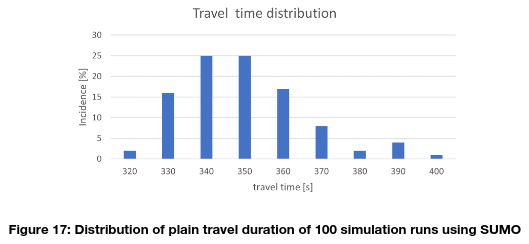
In contrast to the previous metric, these times are much closer together. Therefore, it can be concluded that in a normal case, the traffic light causes the greater temporal uncertainty than the traffic that the shuttle encounters in the shopping center. The public buses, on the other hand, have very little influence on the behavior of the shuttle.
5.2 Autoware Simulator simulation results
The Autoware Simulator scenario build for the bus terminal served two purposes. Firstly, to be able to include VRUs in simulation and verify the correct vehicle behavior this way. Secondly, to design, implement and evaluate a software module, that can propose an empty bus bay in case the SmartCamera is not available.
5.2.1 Autoware Simulator for VRUs
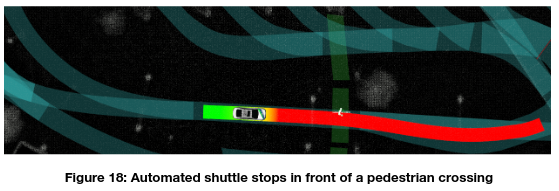
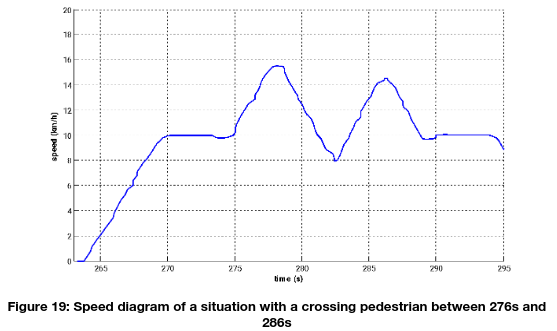
Specific scenarios with pedestrians at the bus stop are tested to evaluate the functionality of the software. The focus is on situations with pedestrians crossing the bus, pedestrians standing at the edge of the vehicle crossing the bus stop, and pedestrians moving freely around the bus terminal area. For example, Figure 18 shows a pedestrian crossing the road and the corresponding speed diagram in Figure 19. The vehicle reduces the speed at time 276s and starts accelerating at 282s. In this case, the automated shuttle did not have to stop, it just reduced the speed to allow the pedestrian to cross safely.
The automated shuttle should not always stop when there are pedestrians at the side of the road, so tests are also performed to verify its functionality. Figure 20 shows a scenario where pedestrians are at the side of the road, but they do not affect the speed profile of the vehicle, as can be seen in Figure 21. The situation with the pedestrians is approximately at time step 185s, no speed reduction is visible compared to figure XYZ. The graph shows the speed profile over a trip through the bus terminal, which takes about 85 seconds.

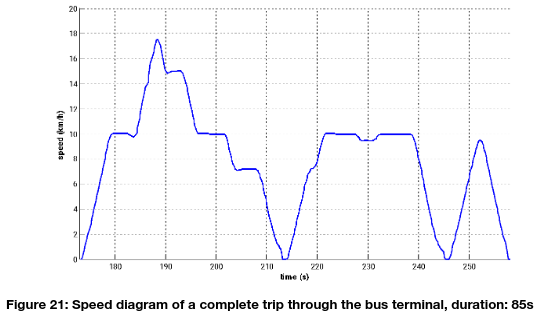
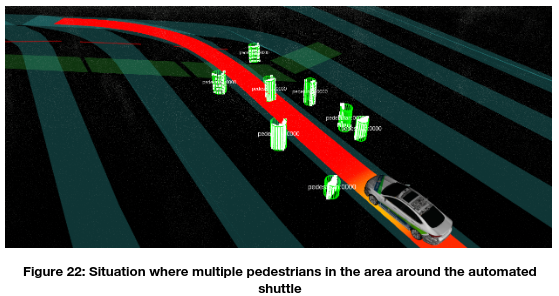
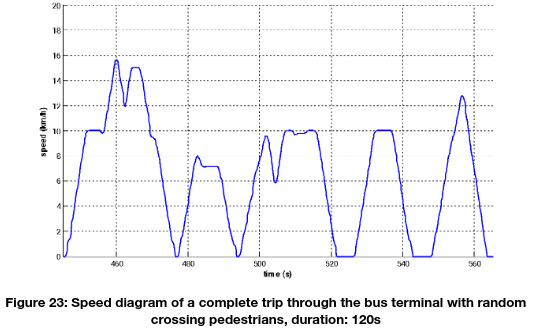
In contrast to the previous scenario, pedestrians are randomly standing and crossing the path during a trip through the bus terminal. A difficult situation is visualized in the following Figure 22. The automated shuttle navigates safely through the bus lane and adapts its speed to the situation. This results in a lower average speed, as shown in Figure 23. For this trip, the automated shuttle takes 120 seconds to pass the entire bus terminal, compared to 85 seconds when there are no pedestrians crossing or standing on the road.
5.2.2 Autoware Simulator for bus bay selection
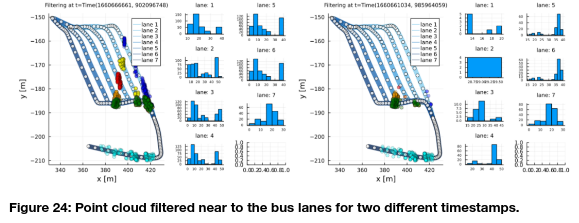
Based on the simulation of the bus terminal, an algorithm for determining the availability of bus bays has been implemented. Figure 13 shows two different point clouds on the same route in the bus terminal. The histograms are for each of the six lanes and one access lane. In comparison, the left histogram in Figure 13 shows a different profile. These different profiles are caused by obstruction when buses and pedestrians obstruct the view. These kinds of patterns are not very intuitive to read by humans because different obstructions, static and dynamic objects, and correlations between each lane section exist. However, a virtual agent learns the data. The location of pedestrians and buses is assumed unknown, making representation learning for the raw data necessary. Two situations for different timestamps are highlighted in Figure 13, where the point cloud near each bus lane is plotted on the two-dimensional plane with corresponding histograms. The LIDAR data on the route is on lane 1 with blue dots, lane 2 with yellow dots, lane 3 with red dots, lane 4 with orange, lane 5 with pink dots, and lane 6 with green dots. Lane 7 is the entrance lane in front of all other lanes 1-6 with cyan lidar points.
5.2.3 Autoware Simulator for road network evaluation
In addition to the correct operation with VRUs, the correct handling of the road network must be tested and evaluated. The correct handling of all stop lines, traffic signals, and road junctions must be tested. Figure 25 shows as example the test of the autonomous driving software behaviour at the traffic light used for the tram crossing. The automated shuttle stops in front of the traffic light and continues driving when the light turns green.

6 Strengths and Limitations
As a matter of principle, it must be noted that simulations only cover the most common and expected scenarios. Rare, unforeseen situations (for example, accident on the track) are usually not taken into account. It must also be clear that simulations can only be as good as the assumptions made (e.g. traffic density) and the input data provided (e.g. map).
6.1 Strengths of SUMO
By using the tool ‘osmWebWizard’ it is now possible to quickly get a map for SUMO simulations. Also traffic flows can be generated with little effort. With simulations generated in this way, some aspects can be estimated very quickly and at an early stage of the project. In our case it was possible to determine a plausible round-trip time for the shuttle and thus finetune the route in consultation with the stakeholders. It is also quite straightforward to estimate the effects of parameters such as the maximum permitted shuttle speed – both on the lap-time and on the existing traffic. More hypothetical questions such as “What would be the effects if we had 10 shuttles available?” can also be answered easily. Another useful application in our case was the creation of a plausible timetable for the shuttle.
6.2 Limitations of SUMO
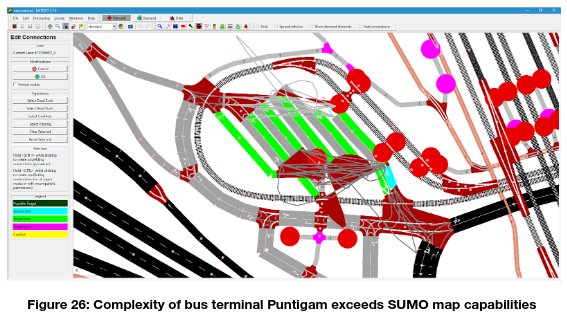
If it is not possible to use the ‘osmWebWizard’ because the road is not mapped, or if the accuracy of the map is not sufficient, then the use of SUMO is a problem. The built-in map editor is very much based on geometric dimensions and it is necessary to specify coordinates very precisely to avoid gaps in the road and make the map unusable this way. Even if there is an accurately measured route, it is time-consuming to draw a map manually. Another difficulty regarding map is its complexity. SUMO is designed for roads, lanes and intersections. If complicated traffic zones, that cannot be described by simple lanes, have to be simulated, then the limits of SUMO are reached. This is the case for example at the Bus Terminal Puntigam (see Figure 14). The unstructured encounter zone is being described by lanes and intersections, but it does not represent the reality on the ground.
Another difficulty in using SUMO is the fact that simulations are hardly reproducible. Although the seed of the random number generator can be set to a specific value, even smallest changes in one vehicle (e.g. shuttle travels at 25 km/h instead of 30 km/h) may trigger feedback loops and simulation results diverge over time and cannot be compared at the end. Therefore, it is generally impossible to make statements with one simulation run, but one has to make many experiments in order to be able to identify certain tendencies using statistical methods.
The evaluation of the large amount of data generated is another weakness of SUMO. Only very few measurements can be examined or evaluated directly in the simulator in a meaningful way. Much of the data has to be collected, processed and interpreted subsequently using scripts from various log files.
6.3 Strengths of Autoware Simulator
In order to test the automated driving functionality in detail, the exact behavior of the system can be recorded and evaluated by the automated driving software using the Autoware simulator. Therefore, the necessary sensor signals must be provided to run the complete automated driving software in simulation. The goal is to test as much as possible in advance, before going to the public bus station, if the system works in the defined area. With this simulator, the gap to reality is quite small.
6.4 Limitations of Autoware Simulator
Detailed modeling of the road network is required to run the simulation. The simulation can only run in real time, not faster. Modeling other road users is difficult, the simulation environment is not designed to simulate scenarios with many other road users. It can be used, but the behavior of each participant must be modeled separately.
6.5 Combination of Autoware Simulator and SUMO
Currently there is no direct way to combine SUMO and Autoware Simulator, as they are different simulation tools for different purposes. SUMO is a traffic simulator that models road networks and vehicle movements, while Autoware Simulator is a scene simulator for autonomous driving that models vehicle dynamics, sensor models and environment configuration. Using the TraCI interface of SUMO, it would be conceivable to access and exchange data. However, the maps are different too and a complicated coordinate transformation would be needed. Consequently, we have chosen an approach for Show where both simulators are only very loosely coupled at the handover point. This way, the advantage of SUMO traffic simulation and Autoware Simulator environment simulation can be combined easily and effectively. Further details on this approach can be found in the corresponding document “Simulation Suite: Connections between Simulation Levels”.
7 Conclusions
The simulations of the Graz pilot site were two folded. The road level simulations using Autoware Simulator were used to develop algorithms for efficient bus terminal passage and to refine the vehicles behavior in the bus terminal area, with many VRUs around.
Higher levels of simulation, covered by SUMO, were performed to determine various KPIs for the journey such as average speed or travel times. It was also used to determine a realistic range of lap times depending on the traffic in the shopping center – important for the preparation of a timetable.
Both simulations were coupled at defined transfer points, since a complete coupling over the entire track would have been very complicated and would have added little value to the overall project.