ROME
Simulating Automated Mobility

1 Scope
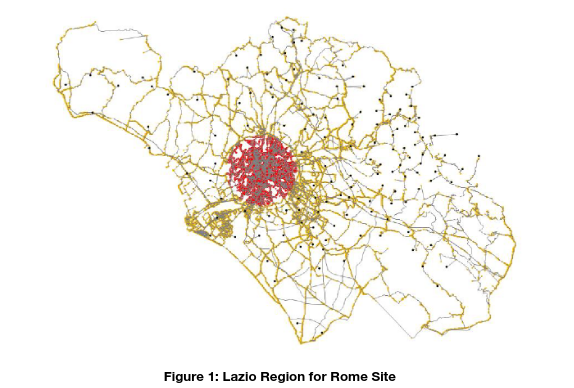
The logistics simulation scenario in Italy is located in Rome. With the available data from the logistics operator, this site is planned for either micro-macro simulation level together with the implementation compatibility determined within some of the SHOW logistics site implementation concepts, in order to address the requirements of the SHOW logistics objectives and evaluation approaches in a comparable pattern. Since the scenarios, citizens’ perspectives and logistics distribution methods are rather similar among the simulation site and the SHOW logistics pilot sites, solid validation links can be established through the number of deliveries and similarities between the distribution zones.
Under this background study, both conventional (for the baseline case) and electrified logistics vehicles (which could also be automated and electrified to simulate the comparison with/without automation) operate along a set path encompassing two specified cases, as briefly outlined hereunder:
- between two hubs (from the urban logistics distribution centre to the transit hubs) in the Rome metropolitan area, and
- from transit hubs, located in optimised positions with respect to distribution routes, to final consumers.
The intention is to build up simulation concepts as a virtual twin test bed for real-world demonstration sites as part of the SHOW project. This logistics simulation concept is designed to be a transferable deployment of the Rome pilot simulation to any of the SHOW project pilot sites. This is to have comparable Italian logistics data that are conceptually relevant for the objectives of the SHOW project’s logistics concepts.
The logistics simulation scenario tests the effects of transfer points and the automated vehicles on traffic congestion, routing, distance travelled, and time before the real-life events take place within the SHOW demonstrations. The driving behaviour will then be analysed along with the various stakeholders being integrated into the simulation model as in the SHOW pilot sites. Several parameters and logistics variants will be used and tested within the simulation.
1.1 Rome site description
The logistics simulation schema is planned to quantify the effects of logistics operations regarding environmental impact and effectiveness. Hence, the data required for the logistics simulation are captured to address the needs of the demonstration; accordingly, this logistics simulation diagram is built on the “Rome Logistics Case Study”. Hereby, the data necessaries for the simulation are acquired from the case study of “Santa Palomba, Rome” (Smart Packaging project, 2019) in the contest of the demonstration objectives together with the predetermined simulation scenarios. The aspects of this completed study site are adequately comparable to the SHOW pilot logistics test sites in terms of the study area and logistics operations specifications.
Depending on the aforementioned facts, the logistics simulation study scenario, covering the case study mentioned previously (Smart Packaging, 2019), was specified in terms of objectives, data availability and scenario attributes. As part of this logistics simulation process, the pre-defined route, road network and influence zones were modeled and later validated as part of the objectives of the SHOW project.
Beyond that, a virtual representation of the real-world traffic network intended for the simulation can have various geographical biases to be identified and adjusted upon the bilateral links with the Italian site and the SHOW pilot sites as satellite sites. Thus, certain commonalities are present between deployment and simulation site attributes, distribution, and citizen specifications for both the simulation and the SHOW logistics sites, as well as distribution approaches. Later on, the logistics simulation will examine energy consumption, travel times, delays, interchanges, effects on other road users and driving behaviour.
The intention of the data gathered is to further examine the distribution of e-commerce deliveries in the district and/or the city of Rome. Thus, it is to supply a service to transit points from urban distribution centres so as to save distance and time while distributing the same number of deliveries in the urban environment. Similarly, this is likely to adopt a point-to-point distribution strategy, comparable to the SHOW project’s pilot logistics deployments. To do so, the urban distribution hub (Santa Palomba, Pomezia) distributes goods to transit points that will then deliver the materials to final consumers. Based on that, the transit points shall be positioned as various interim nodes in the territory of the Municipality of Rome. Such transit points would then distribute the products/materials to final consumers within the on-time delivery approach.
1.2 Trikala site description
The Rome Logistics Simulation collected data from the Rome Case Study, along with data from the automated vehicles of the SHOW Trikala site. A delivery service is being provided between the municipal building, the pick-up point and the delivery points which are the courier operator owned three delivery kiosks located in the pedestrian area of the city.
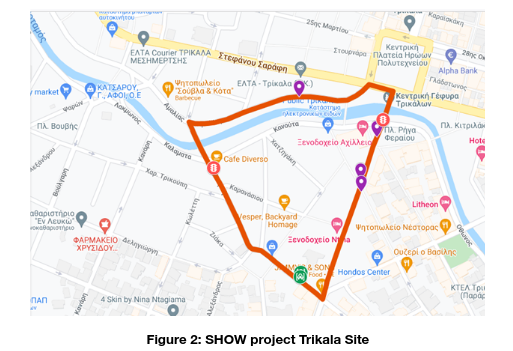
A droid fleet of five Yape Droids supplies a delivery service for parcels/envelopes between the municipal building and the delivery points and other goods from suppliers between the municipal car park and the three delivery kiosks. These services are carried out once or twice per day, depending on the demand.
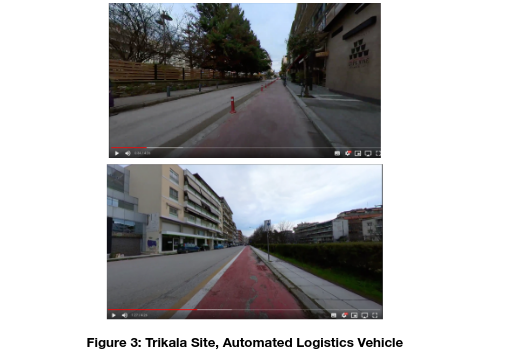
The delivery droids are moved across a cycle track, which is almost a flat one. The width of the cycle track generally is 1.50 m, with a few narrower parts being 1.20 m. The cycling lane is on the carriageway as it runs in parallel to the pedestrian lane. The cycling path is partially physically separated by barriers from the carriageway and partially separated by painted markings on the carriageway as well. The two kinds of cycling lanes are presented in the figure below.
1.3 Gothenburg Site at Chalmers University
Besides the data obtained from the case study in Rome and the SHOW site in Trikala, a further SHOW logistics pilot site, the one in Gothenburg at Chalmers University, is to support the gathering of logistics simulation data. A number of tests were being executed with delivery robots, with an emphasis on the physical co-ordination processes. Hence, the initial testing was performed in March 2023 at the Keolis depot in Mölndal. The testing period was completed in early June 2023 at the SHOW site at Chalmers University in Gothenburg.
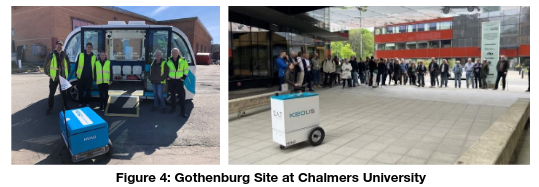
The concept is a combination of goods transport with an automated cargo robot getting on board an automated passenger transport vehicle to achieve extended durability with more rapid shipments. This hitch-hiking solution was tested by utilising the disabled ramp on the Navya Arma Automated Passenger Vehicle. To begin with, it was necessary to verify that the automated logistics robot was able to communicate with the vehicle ramp to verify that the robot could deal with the vehicle ramp, and after such verification, a system was built to determine where to meet during the route with the automated shuttle and automated logistics robot.
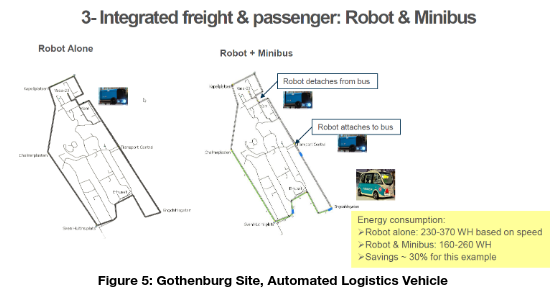
The testing was performed through manual interaction (the robot is being controlled by a computer) along with the use of a ramp on self-driving vehicles. A number of tests were conducted over, and it was observed that with normal wheel pressure on the robot, there was a risk of spinning. The wheel pressure was around 0.5 bar, so the tests showed that the robot had sufficient grip to be able to cope with the ascent of the ramp by about 7 percent. The Hugo logistics robot used in those tests had a 2-axle, 4-wheel configuration. The testing is being prepared for a combination of automated vehicles and cargo robots to be deployed on the campus in urban environments.
1.4 Simulation network
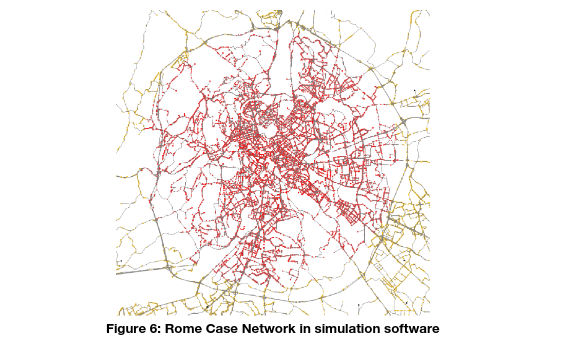
1.4.1 Rome case study simulation network
The logistics scenario is established in the context of distribution zones; more specifically, the deliveries presently being made straight to the final consumers (main hub to transit point, from transit point to final consumers). In the context of the simulation, the logistics scenario consists of the main distribution zone deliveries to the transit points (in an area close to the final consumers); then, there is another service (perhaps simulating electric or environmentally friendly logistics vehicles) that departs from those transit points into the relevant area to deliver to the final consumers.
The automated logistics delivery scenario comprises two parts. The first stage of the scenario consists of the deliveries from the main hub to transit points to serve certain territories based on the delivery dispatch postcodes. Later on, the second stage shall correspond to time-responsive deliveries related to customer wishes to transfer goods, which are being delivered, from transit points to final consumers. In short, the logistics simulation scenario covers two different aspects: the first approach works on deliveries to transit points; the second one transfers shipments from transit points to final consumers. In appearance, the concept is about timing (when the customer places the request-order, how the company-organisation manages the delivery) and the simulation includes such process times.
As for the simulation models, the positioning of transit points relies on the simulation assumptions, which are also dependent on various parameters. A centroid, complying with an area to be served, would most reasonably be positioned in the core of the communication network between the business-to-business area and the distribution nodes. A clustering of the postcodes in the city/province of Rome is required; thus, the postcodes in the province of Rome distinguish 138 sets of clusters. In the case of a concentration, an analysis shall further process clustering based on postcodes in the city of Rome (or the province of Rome). Based on the data gathered through the PRMTL Monitoring project, together with all the data collected by the benchmark monitoring project (PRMTL Monitoring Lazio, 2022), 35 streets were identified as representing the commercial and delivery districts in the city of Rome. The data was then collected from real-life logistics operations as well as being analysed to further pinpoint the logistics access routes in the capital area.
1.5 Simulation parameters
In the case of an automated logistics simulation, a variety of data are needed for the routing and optimization, such as the time frames at the stopping points, the route timing and the logistics users’ wishes to get the delivery at a particular time (on a certain day). Although delivery details are also available, the booking details section is not stated (it refers to the fact that it is not clear when the delivery request was made by the logistics service users).
The order requests are supposed to be represented by lines. Hence, each order represents one line; lines of orders that can be part of the same shipment. Multiple lines would belong to the same consignment as there is the option of ordering three different goods that arrive at the same delivery address; consequently, a single line would describe three deliveries as a single consignment – a shipment made up of items being delivered from the same delivery area, the consignment would consist of multiple order lines. The variations of logistics simulation scenarios are presented here below:
- Baseline: Cargo Transport in conventional traffic without designed transfer points and automated vehicles
- Variant 1: Cargo Transport with designed transfer points via non-automated vehicles whereas maximum speed cannot exceed 25km/h.
- Variant 2: Cargo Transport with designed transfer points via automated vehicles whereas maximum speed cannot exceed 25km/h.
- Variant 3: Cargo Transport with designed transfer points via non-automated vehicles whereas maximum speed can exceed 25km/h.
- Variant 4: Cargo Transport with designed transfer points via automated vehicles whereas maximum speed can exceed 25km/h.
- Variant 5: Cargo Transport without designed transfer points via automated vehicles whereas maximum speed cannot exceed 25km/h.
- Variant 6: Cargo Transport without designed transfer points via automated vehicles whereas maximum speed can exceed 25km/h.
- Variant 7: Cargo Transport with designed transfer points via automated vehicles whereas maximum speed can exceed 25km/h and minimum risk maneuvers.
- Variant 8: Cargo Transport without designed transfer points via automated vehicles whereas maximum speed can exceed 25km/h and minimum risk maneuvers.
The following table represents the details of the simulation scenario and variants as briefly listed below:
Table 12: Logistics simulation scenario baseline and variants (Rome Scenario)
| Scenario Name | Scenario Variant | Scenario Description |
| Baseline | – | Cargo Transport in conventional traffic without designed transfer points and automated vehicles |
|
Variant 1 (non-automated + transfer points + low speed) |
Non-Automated logistics vehicles Operated with designed transfer points Maximum speed cannot exceed 25km/h |
|
|
Variant 2 (automated + transfer points + low speed) |
Automated logistics vehicles Operated with designed transfer points Maximum speed cannot exceed 25km/h |
|
| Logistics Simulation Scenario |
Variant 3 (non-automated + transfer points + high speed) |
Non-Automated logistics vehicles Operated with designed transfer points Maximum speed can exceed 25km/h |
|
Variant 4 (automated + transfer points + high speed)
|
Automated logistics vehicles Operated with designed transfer points Maximum speed can exceed 25km/h |
|
|
Variant 5 (automated + without transfer points + low speed) |
Automated logistics vehicles Operated without designed transfer points Maximum speed cannot exceed 25km/h |
|
|
Variant 6 (automated + without transfer points + high speed) |
Automated logistics vehicles Operated without designed transfer points Maximum speed can exceed 25km/h
|
|
|
Variant 7 (automated + transfer points + high speed + min risk) |
Automated logistics vehicles Operated with designed transfer points Maximum speed can exceed 25km/h Minimum risk maneuvers are allowed |
|
|
Variant 8 (automated + without transfer points + high speed + min risk) |
Automated logistics vehicles Operated without designed transfer points Maximum speed can exceed 25km/h Minimum risk maneuvers are allowed |
|
1.6 Simulation scenarios
The positioning of the transit points (e.g., they would be positioned east-west-north-south of Rome) is based on simulation projections that also depend on numerous parameters. A centroid, respecting an area to be served, would very reasonably be positioned in the center of the communication network between the commercial-business area and the distribution hubs.
From the central hub (main-hub) in Pomezia to the transit points, the simulation scenario also analyses the service variables with respect to the delivery flow to final customers – which means – from main-hub to transit points (to locate these points efficiently) and then from there to final customers with respect to the booked delivery time. The routing optimization works on these transit points positioned as the first routing from the main hub to them; subsequently, the routing will consider the optimization of the final deliveries with respect to the time from the transit points to the final customers. The logistics simulation can even include a hub-to-hub case and a hub-to-customer case related to previously defined cases.
2 Tools
The logistics industry is on the brink of a technological revolution, driven by the rise of automated vehicles. As self-driving and autonomous technologies continue to advance, transportation planners and researchers are faced with the challenge of understanding and optimizing the behavior of these automated vehicles within the logistics network. In this article, we will explore how simulation tools like AnyLogic and TransCAD can help model and simulate automated logistics vehicle behavior, enabling transportation professionals to unlock the full potential of this transformative technology.
Automated logistics vehicles, such as autonomous droids and delivery drones, offer tremendous opportunities for the logistics industry. They have the potential to increase efficiency, reduce costs, and enhance safety by eliminating human error and enabling round-the-clock operations. However, integrating these vehicles into existing logistics networks requires a thorough understanding of their behavior and interaction with the surrounding environment.
AnyLogic, a powerful simulation software, provides a versatile platform for modeling and simulating automated logistics vehicle behavior. With its multi-method modeling capabilities, including agent-based, discrete event, and system dynamics approaches, AnyLogic allows transportation planners to create dynamic models that replicate the complex interactions between automated vehicles, infrastructure, and other agents in the logistics network. This enables the evaluation of different scenarios, policies, and strategies to optimize the performance of automated logistics operations.
TransCAD, a specialized transportation planning software, offers unique features for modeling and analyzing automated logistics vehicle behavior. Its advanced routing and scheduling capabilities allow transportation professionals to optimize the movement of automated vehicles, taking into account factors such as vehicle capacity, traffic conditions, delivery time windows, and customer demands. TransCAD’s simulation tools enable the evaluation of different routing algorithms, operational policies, and fleet management strategies to maximize efficiency and minimize transportation costs.
Modeling automated vehicle behavior involves capturing the unique characteristics and decision-making processes of these vehicles within the logistics network. Simulation tools like AnyLogic and TransCAD provide the means to represent various aspects, such as:
- Vehicle Movement: Simulating the movement of automated vehicles, including acceleration, deceleration, lane changing, and interaction with other vehicles and infrastructure elements.
- Traffic Flow: Modeling the impact of automated vehicles on overall traffic flow, considering factors such as platooning, traffic congestion, and cooperative behavior.
- Routing and Scheduling: Optimizing routes and schedules for automated logistics vehicles based on real-time data, traffic conditions, and operational constraints.
- Load Optimization: Analyzing and optimizing the allocation of goods and parcels within automated vehicles, considering factors like load balancing, vehicle capacity, and delivery priorities.
- Safety and Collision Avoidance: Evaluating collision avoidance algorithms and safety measures to ensure the smooth and secure operation of automated logistics vehicles in the logistics network.
3 Key Inputs and Outputs
3.1 Data used
Logistics Data derived from case study
Data are available for approximately 34788 different products, with product delivery codes, transferred during the observed time period between 2 March 2017 and 5 December 2018. However, the deliveries (in total) are about 1.380 million for the orders that were placed; obviously, this is a study that was done throughout Italy. It is therefore necessary to filter only those recipients that are in the province (or city) of Rome.
For this objective, a clustering of the postcodes of the city/province of Rome is necessary; therefore, the postcodes of the province of Rome distinguish 138 sets of clusters. For concentration, the analysis must work on the city of Rome (or the province of Rome) for further clustering based on postcodes.
With the Rome postcodes, one should emphasize those areas to designate essentially a secondary distribution pole. Furthermore, each postcode can have an intermediate distribution hub; otherwise, there would be many secondary hubs that would not make sense for the distribution of materials to final customers on time. Consequently, more in-depth grouping according to certain postcodes is required; for example, grouping by a dozen postcodes or postcode meaning zones (one secondary hub per municipality, from the main one to this secondary one, then to the end customer via distribution hubs).
Driving Data derived from pilot sites
The assumption of the automated logistics vehicle is based on real-life demonstration sites provide valuable insight into a unique opportunity to collect accurate driving data from automated vehicles operating under real-life conditions. This data includes a large amount of valuable information, including vehicle movements, environmental factors, traffic patterns, road conditions and unforeseen challenges.
Real-life driving data guarantees that logistics simulations accurately represent the challenges and complexities that autonomous vehicles encounter. It makes it possible for developers to generate feasible scenarios, including a variety of traffic situations, environmental factors and driving patterns.
By analysing data from real-life logistics demonstration scenarios, it is possible to identify potential safety risks and optimise the behaviour of automated vehicles correspondingly. This data-driven concept contributes to improving the decision-making capabilities of automated vehicles, enabling them to navigate complex scenarios more safely.
Real-life logistics driving data can be used to build different scenarios for testing and validation activities. Logistics Simulations can be planned to replicate specific scenarios that are encountered during data collection, allowing developers to measure the performance of automated vehicles and make necessary improvements.
As all mentioned points, the real-life logistics demonstrations data will be utilized as assumptions for the automated logistics vehicle presence on the simulation, as it is mentioned under the previous chapter, as well as respecting other studies.
3.2 Extracted KPIs
Simulation overall progress, based on the previously mentioned data fields, several expected key performance indicators will be addressed, by collecting required input data, both from simulation site and linked SHOW pilot site(s), from logistics simulation scenarios, as listed below:
- Travel time
- Distance
- Average speed
- Fuel consumption
- Avoided conflicts
- Flow
- Duration and Length saving thanks to routing- optimization
- Frequency
- Number of deliveries
- Failures of processing
- O-D relations (matrix)
4 Followed Models
An accurate modelling of the behaviour of automated logistics vehicles is a further competitive aspect of automated logistics simulations. The behaviour of such automated logistics vehicles has a fundamental role to play in influencing their performance, efficiency and interaction with other elements of the logistics system.
Logistics Simulation models incorporating precise automated logistics vehicle behaviour facilitate the study of how automated logistics vehicles interact with urban environment, as well as pedestrians and other road users. This can identify any possible bottlenecks, optimise traffic flow and boost the overall efficiency of logistics operations. By modeling the real-life behaviour of automated vehicle systems and perception systems, logistics simulations can more effectively replicate real-life urban logistics operations. Thus, the performance of automated logistics can be measured, perception algorithms can be optimised and potential limitations or challenges can be identified. Modelling automated logistics vehicle behaviour also incorporates logistics simulation for decision-making processes. Thereby, such factors as logistics route planning, obstacle avoidance and compliance with traffic regulations can be taken into account. By accurately modelling decision-making algorithms, a variety of optimisation strategies and techniques can be investigated, leading to more efficient and effective automated logistics systems.
As the logistics sector further advances to automated logistics processes, the use of real-life data and accurate modelling of vehicle behaviour will be essential to develop reliable and robust automated logistics systems. By exploiting the potential of such advances in simulation techniques, logistics stakeholders can achieve significant benefits, simplify operations and smooth the transition to a more efficient and automated logistics processes in the future. In the field of automated logistics, simulation has a fundamental role to perform in optimising operations, improving efficiency and reducing costs. A crucial aspect of such simulations is modelling the behaviour of automated vehicles. Accurate and realistic modelling provides logistics stakeholders with insights into the performance, safety and efficiency of automated vehicles in a virtual environment. This article explores the capabilities of two major simulation software platforms, AnyLogic and TransCAD, in modelling the behaviour of automated vehicles for logistics simulations.
AnyLogic is a powerful and versatile simulation software that offers extensive functionality for modelling complex systems, including automated vehicles. AnyLogic allows the creation of individual agents representing automated vehicles, each with its own behaviour, decision rules and interactions. This agent-based approach enables detailed representation of vehicle behaviour in various scenarios, taking into account factors such as speed, acceleration, lane changing and overtaking. AnyLogic offers a flexible modelling environment in which users can define customised behaviour rules for automated vehicles. These rules can be based on real data, traffic regulations or specific operational requirements. By specifying the behaviour of vehicles in detail, users can simulate and precisely analyse the interactions and performance of automated vehicles. AnyLogic incorporates sophisticated traffic flow simulation models, allowing users to replicate real traffic scenarios and study the impact of automated vehicles. The software considers factors such as traffic density, congestion, traffic light control and interactions with other road users. This comprehensive traffic modelling capability helps evaluate the effectiveness of different vehicle behaviour strategies and traffic management approaches.
Another logistics simulation tool is TransCAD, a leading transport planning software that also offers functions for modelling the behaviour of automated vehicles. Although designed primarily for transport planning, TransCAD can be used to simulate logistics scenarios involving automated vehicles. TransCAD offers dynamic traffic assignment functions, which allow traffic flows influenced by automated vehicles to be modelled. By simulating interactions between autonomous and human-driven vehicles, users can assess the impact on overall traffic patterns, congestion and travel times. This helps to understand the behaviour of automated vehicles in the context of the existing transport infrastructure. TransCAD enables users to optimise traffic signal timing by taking into account the presence of automated vehicles. By modelling the behaviour of autonomous vehicles at signalled intersections, users can fine-tune signal timing to improve traffic flow, reduce delays and increase overall system efficiency. This capability ensures that simulations accurately reflect the impact of automated vehicle behaviour on traffic operations. TransCAD offers comprehensive scenario analysis and visualization tools, allowing users to study and interpret the results of automated vehicle behaviour modelling. The software provides detailed reports, graphs and maps for analyzing the performance of autonomous vehicles in various logistics scenarios. This helps to identify bottlenecks, optimise routes and make informed decisions to improve logistics operations.
As the logistics industry increasingly advances to include automated solutions, advanced simulation tools such as AnyLogic and TransCAD are likely to further play an important role in the design and optimisation of automated logistics processes, leading to increased efficiency, cost savings and customer satisfaction.
5 Results
Simulation future plans
The logistics simulation will be implemented immediately after the deadline of the deliverable. The case study of the automated logistics simulation will require further data gathering and categorization due to the erroneous collection of operator data. This is since the available data covers the entire Italian distribution area and all areas of Rome. This data will have to be further processed according to the requirements of the SHOW automated logistics simulation. In the meantime, the automated logistics site in Rome should cover similar areas as the SHOW site in Trikala. To this regard, data will be accumulated according to such specifications. As part of this approach, the deployment will be examined to have a solid connection with the SHOW logistics pilot sites; in particular, a link to the Trikala site. It is most likely that the Trikala site will have similar distribution characteristics to the Rome case study, such as the Trikala site will only have a logistics implementation like the Rome simulation, and the Trikala site will cover a shopping street and attraction points like the Rome simulation site. A further point is that the Trikala site was subjected to similar logistical distribution studies as the Rome site, due to the similar perspectives of citizens, logistics distributions and regulative concerns.
Subsequently, the data will be analyzed and used to work and calibrate appropriate models, sufficient to reflect real-world logistics services and the possible inclusion of automated logistics vehicles. In this way, the tests will ensure that the microscopic logistics simulation model is developed. As the data available from the Rome site (both micro-macro levels) are similar to those available from the Trikala site (as micro level), microscopic simulation models will be guaranteed. A further step forward, the assembled data would also enable a macroscopic level of simulation through the classified data from the Rome site. This simulation will make it possible to more accurately predict the impacts expected from the introduction of transit points and automated logistics vehicles along optimized routes. This will allow the evaluation of different routes and the management of logistical transit points to facilitate and improve logistical operations, the location of transit points and automated logistical vehicles.
6 Strengths and Limitations
Strengths of Automated Vehicle-Involved Logistics Simulation:
- Simulation tools allow for a realistic representation of automated logistics vehicle behavior, considering factors such as vehicle dynamics, traffic flow, routing, and scheduling. This provides an accurate assessment of the performance and efficiency of automated logistics operations.
- Simulation enables to test different scenarios and strategies in a controlled virtual environment. It allows for the evaluation of various parameters, such as fleet size, vehicle routing, load optimization, and safety measures, without incurring the costs and risks associated with real-world implementation.
- Automated vehicle-involved logistics simulation facilitates the optimization of operations, leading to improved efficiency and cost reduction. By analyzing and adjusting variables such as vehicle routes, scheduling, and load allocation, to identify opportunities for increased productivity and resource utilization.
- Simulation provides a platform to assess potential risks associated with automated logistics vehicle behavior. It allows for the evaluation of safety protocols, collision avoidance strategies, and the impact of integrating automated vehicles into the existing logistics network. This aids in developing mitigation strategies to minimize risks and ensure safe operations.
- Simulation tools help transportation planners assess the infrastructure requirements and modifications necessary for accommodating automated logistics vehicles.
Limitations of Automated Vehicle-Involved Logistics Simulation:
- Simulation relies heavily on data inputs, including vehicle characteristics, traffic patterns, customer demand, and infrastructure details. Obtaining accurate and up-to-date data can be a challenge, and any inaccuracies or limitations in the data can affect the reliability and validity of the simulation results.
- Simulating automated vehicle behavior in logistics networks requires complex modeling techniques. Developing accurate representations of vehicle dynamics, traffic flow, and decision-making processes can be challenging and time-consuming. Transportation planners may need expertise in modeling and simulation techniques to effectively utilize simulation tools.
- The logistics environment is dynamic, with constantly changing variables such as traffic conditions, customer demands, and operational constraints. Simulation models need to be regularly updated to reflect these changes accurately. Failure to incorporate real-time or dynamic elements may limit the accuracy and usefulness of the simulation results.
- Modeling the behavior of automated vehicles accurately can be a complex task. Anticipating the responses to various scenarios and interactions with other vehicles, pedestrians, and elements may require assumptions and simplifications that may not capture the full complexity of real-world behavior.
- Simulation tools, particularly those capable of modeling complex logistics networks with automated vehicles, may require substantial computational resources. Running simulations involving many vehicles or complex scenarios can be time-consuming and computationally intensive, which may limit the practicality of running multiple simulations or performing real-time analysis.
Overall, while automated vehicle-involved logistics simulation has significant strengths in optimizing operations and evaluating performance, it is essential to be mindful of the limitations, such as data availability, model complexity, and the dynamic nature of the logistics environment, to ensure accurate and reliable simulation results.
7 Conclusions
In conclusion, the objective of automated logistics simulation through modeling automated logistics vehicle behavior has to prove a crucial and effective approach in optimizing the efficiency, accuracy, and safety of logistics operations. Through the use of advanced simulation techniques and sophisticated modeling algorithms, this objective has provided valuable insights into the behavior of automated logistics vehicles, allowing for better understanding and prediction of their performance in real-world scenarios.
References
- AnyLogic: Simulation Modeling Software. (n.d.). Retrieved from https://www.anylogic.com/
- TransCAD: Transportation Planning Software. (n.d.). Retrieved from https://www.caliper.com/transcad
- Liu, S., & He, Q. (2019). Modeling and Simulation of Autonomous Logistics Systems. In Proceedings of the 2019 IEEE International Conference on Industrial Engineering and Engineering Management (IEEM) (pp. 1227-1231). IEEE.
- Wang, S., & Zhu, C. (2020). A simulation-based optimization approach for drone delivery in urban areas. Transportation Research Part C: Emerging Technologies, 119, 102787.
- Zhang, Y., Zhang, J., & Wang, X. (2019). Development of a Vehicle Routing Problem Model for Last-Mile Logistics Based on Real-Time Traffic Information. Sustainability, 11(6), 1761.