TRIKALA
Simulating Automated Mobility
1 Scope
The scope of the Trikala pilot site encompasses the investigation of the operation of connected and automated shuttles along a peri-urban fixed route in the city of Trikala, Greece. A microscopic traffic simulation analysis has been conducted to assess the impacts of the introduction of the automated shuttles on traffic flow performance along the peri-urban route. The simulation analysis accounts for all the road user types that are encountered by the automated shuttles in the real-world experiment (pedestrians, conventional passenger cars, trucks and public transport). Furthermore, focus has been also placed on the evaluation of the interactions between the automated shuttles and other road users to examine under which conditions automated driving is feasible in a complex road environment and with what consequences.
1. 1 Trikala pilot site description
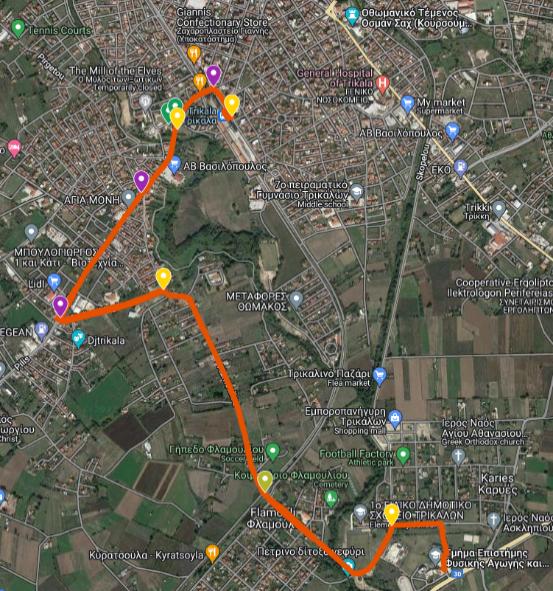
The automated shuttles have been deployed along the peri-urban route of the Trikala pilot site that is depicted in Figure 1. The service route connects the Train Station with the Department of Physical Education and Sports Science, crosses different land uses (residential and non-residential), and is used by multiple road users (pedestrians, passenger cars, buses and trucks). There are 2 signalized intersections, 2 railroad crossings and 12 bus stations along the service route. The automated shuttles deployed along the service route are 2 electric Peugeot e-Traveller (4.95-meter with 8 seats).
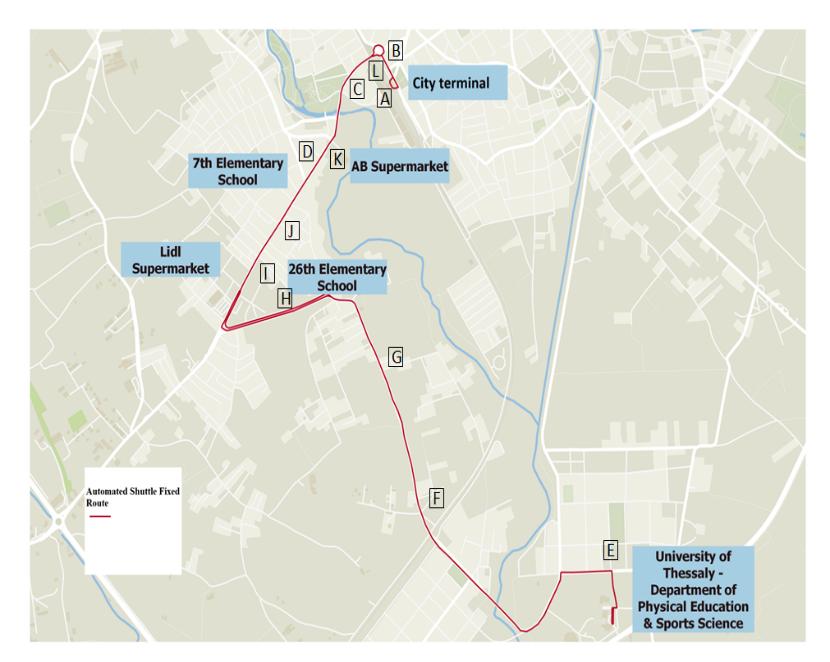
Figure 1: Trikala Pilot Site
1.2 Simulation Network
1.2.1 Trikala pilot site simulation
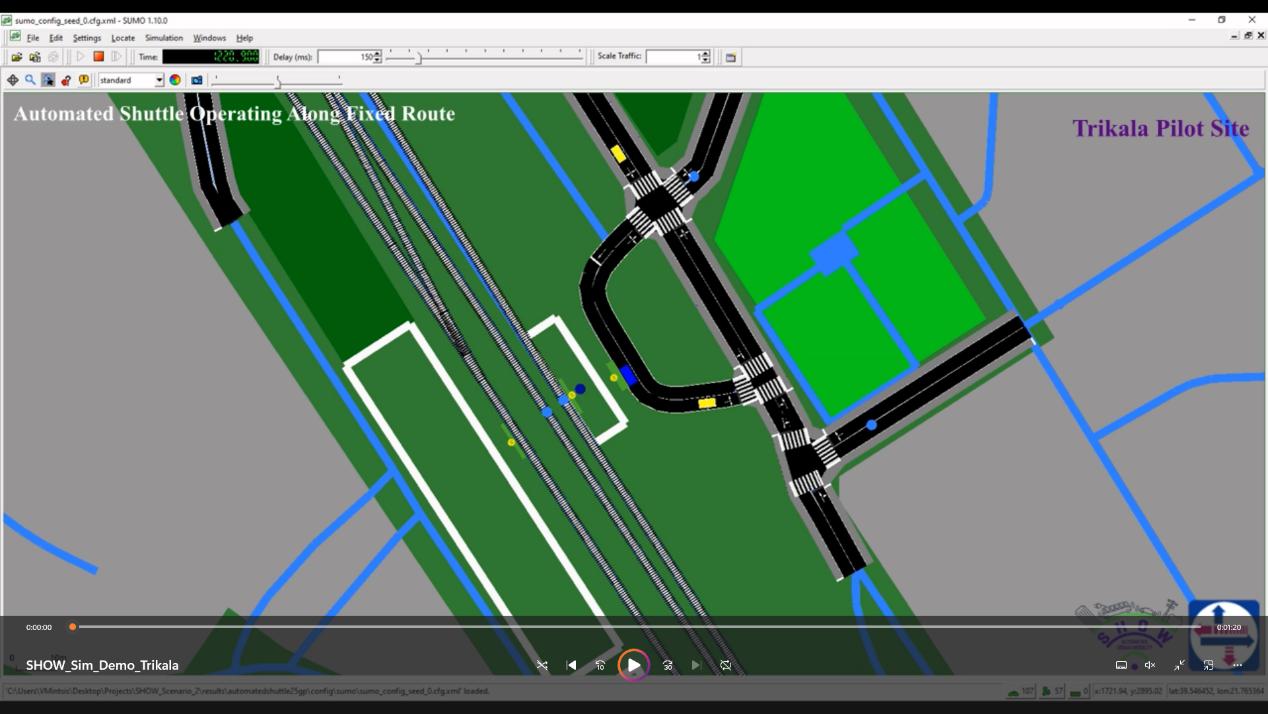
The simulation network of the Trikala pilot site explicitly includes the peri-urban route that connects the Train Station with the Department of Physical Education and Sports Science and the train line that intersects the latter route. It consists of 80 nodes and 133 road segments, as depicted in Figure 2. In addition, the total length of the service route is 9.7 km and the network size reaches approximately 0.8 km2. Furthermore, the simulated transport network includes at present 3 bus lines and 12 public transport stops, which were also included in the simulation model as well as frequencies and waiting times at stops, obtained from the website of the bus operator. The OD matrices that were utilised consist of 13 centroids, across the study network and the travel demand is 1,422 cars trips, 123 trucks trips and 2 train trips within midday peak hour.
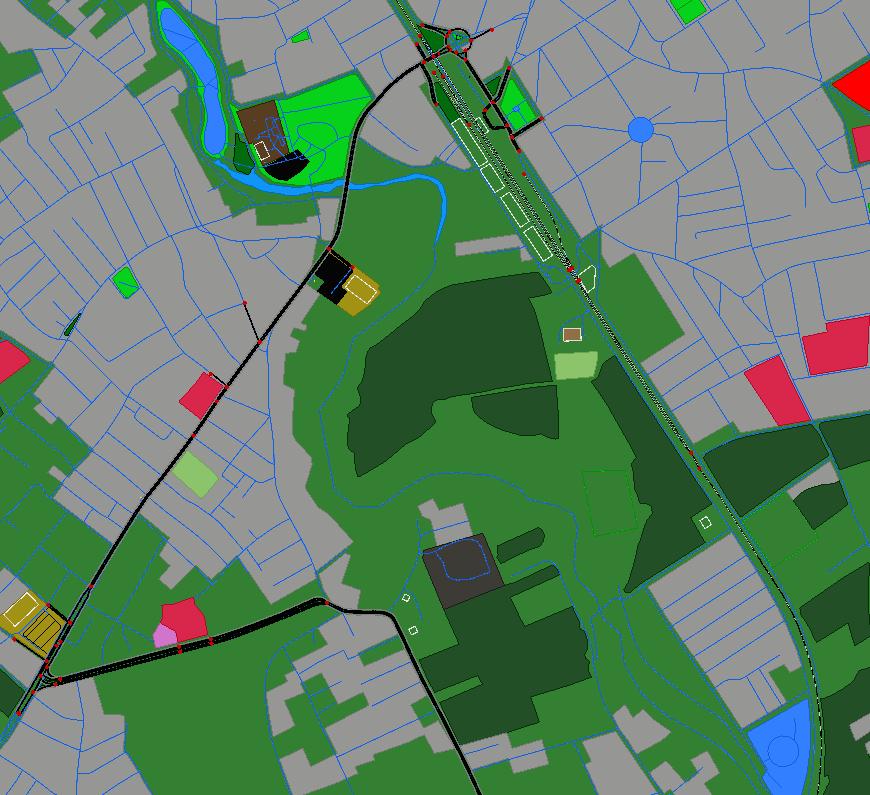
Figure 2: Simulation network of Trikala pilot site
The automated shuttles have been also integrated into the simulation model. They run at fixed 30-minute intervals (i.e. there are two departures every hour). There are 12 bus stops along the 9.7 km long service circular route. The shuttles are electric and operate in automated driving mode throughout the whole route. The automated shuttles are Peugeot e-Traveller vehicles with a total capacity of 8 passengers; their dimensions are 4.95 m in length and 1.92 m in width.
1.3 Simulation Paramaters
The simulated behavior of the automated shuttles was dictated by an Adaptive Cruise Control (ACC) model that handled car-following episodes and a Transition of Control (ToC) model that handled control transitions between manual and automated driving modes. The latter models were parametrized (Table 1) according to findings from the H2020 TransAID project [1], [2], [3] and the requirements of the simulation scenarios. One the other hand, the simulated behavior of conventional vehicles was determined according to the default car-following and lane changing models of the microscopic traffic simulator SUMO (i.e. Krauss car-following model, LC2013 lane change model). The selected parametrization of the default models is depicted in Table 2.
Table 1: Parametrization of car-following and ToC models for automated shuttles per simulation scenario
| Factor |
Variant 1 (Teleoperation + Low speed) |
Variant 2 (Teleoperation + High speed) |
Variant 3 (AV mode + Low speed) |
|---|---|---|---|
| Driver’s imperfection factor | 0 | 0 | 0 |
| Desired time headway (s) | 1.5 | 1.5 | 1.5 |
| Deceleration ability of vehicles (m/s2) | 3.5 | 3.5 | 3.5 |
| Acceleration ability of vehicles (m/s2) | 1.5 | 1.5 | 1.5 |
| Emergency deceleration (m/s2) | 9.0 | 9.0 | 9.0 |
| Response Time (s) | – | – | 90 |
| Initial Awareness | – | – | 0.87 |
| Recovery Rate | – | – | 0.015 |
|
MRM Deceleration Rate (m/s2)
|
– | – | 3 |
Table 2: Parametrization of car-following and lane change models for conventional vehicles
Factors |
Conventional Vehicles |
| Driver’s imperfection factor |
Mean 0.2 Min 0.0 St.Dev 0.5 Max 1.96 |
| Desired time headway (s) |
Mean 0.2 Min 0.0 St.Dev 0.5 Max 1.6 |
| Acceleration ability of vehicles (m/s2) |
Mean 2.0 Min 1.0 St.Dev 1.0 Max 3.5 |
| Deceleration ability of vehicles (m/s2) |
Mean 3.5 Min 2.0 St.Dev 1.0 Max 4.5 |
| Emergency deceleration (m/s2) | 9.0 |
| Willingness to accept gaps |
Mean 1.2 Min 1.1 St.Dev 0.05 Max 1.3 |
1.4 Simulation scenarios
Several simulation scenarios have been developed to assess the impacts of the introduction of the automated shuttles on traffic flow. The examined simulation scenarios account for different manoeuvring capabilities of the automated shuttles (e.g. different maximum operating speeds, ability to perform control transitions). Additionally, the deployment of green priority for the automated shuttles at signalized intersections is evaluated. In more detail, one baseline and six different variants (baseline, variant 1-6) of scenario 1 (Table 3) were studied:
● Baseline: Conventional traffic without automated shuttles
● Variant 1: Two automated shuttles are teleoperated via AV fleet Control Centre whereas their maximum driving speed cannot exceed 25 km/h.
● Variant 2: Two automated shuttles are teleoperated via AV fleet Control Centre whereas their maximum driving speed cannot exceed 50 km/h.
● Variant 3: Two automated shuttles operate in automated driving with maximum driving speed of 25 km/h whereas transitions of control (ToCs) and minimum risk maneuvers (MRMs) are possible, see Figure 3.
● Variant 4: Two automated shuttles operate in automated driving with maximum driving speed of 50 km/h whereas transitions of control (ToCs) and minimum risk maneuvers (MRMs) are possible, see Figure 3.
● Variant 5: Two automated shuttles are teleoperated via AV fleet Control Centre with maximum driving speed of 25 km/h and they receive green priority at signalized intersections.
● Variant 6: Two automated shuttles are teleoperated via AV fleet Control Centre with a maximum speed of 50 km/h and they receive green priority at signalized intersections.
Scenario Name |
Scenario Variant |
Scenario Description |
| Baseline | – | ● Conventional traffic without automated shuttles |
| Varient 1 (Teleoperation + Low Speed) |
● Automated shuttles teleoperated via Fleet Management Centre, ● Automated shuttle speed cannot exceed 25 km/h. |
|
| Scenario 1 | Variant 2 (Teleoperation + High Speed) |
● Automated shuttles teleoperated via FleetManagement Centre. ● Automated shuttle speed cannot exceed 50 km/h. |
| Variant 3 (AV mode + Low Speed) |
● Automated shuttles operate in automated driving mode. ● Control transitions and minimum risk manoeuvres are possible. ● Automated shuttle speed cannot exceed 25 km/h. |
|
| Variant 4 (AV mode + High Speed) |
● Automated shuttles operate in automated driving mode. ● Control transitions and minimum risk manoeuvres are possible. ● Automated shuttle speed cannot exceed 50 km/h. |
|
| Variant 5 (Variant 1 + Green priority) |
● Automated shuttles teleoperated via Fleet Management Centre . ● Automated shuttle speed cannot exceed 25 km/h. ● Automated shuttles receive priority at signalized intersections. |
|
| Variant 6 (Variant 2 + Green priority) |
● Automated shuttles teleoperated via Fleet Management Centre. ● Automated shuttle speed cannot exceed 50 km/h. ● Automated shuttles receive priority at signalized intersections. |
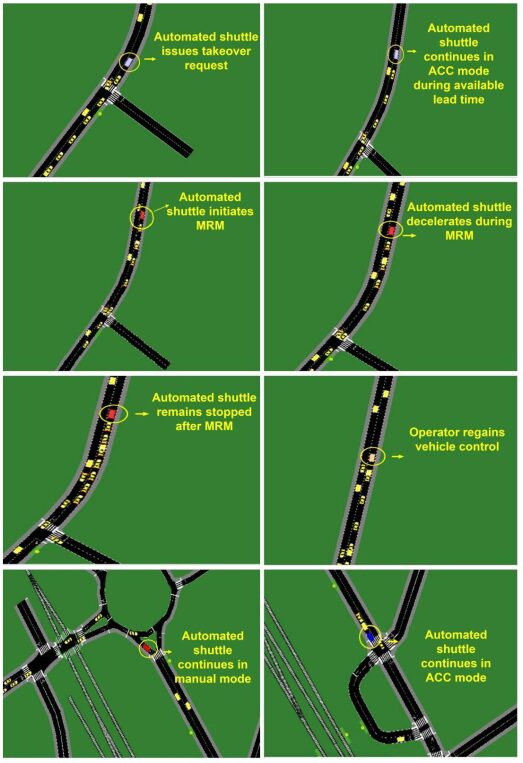
Figure 3: Snapshots of variant 3 in SUMO
Additionally, 10 distinct replications of each simulation scenario were run using different random seeds (numbers used to initialize a pseudorandom number generator). Each simulation scenario had a duration of 1 hour during midday peak conditions. The automated shuttles were simulated as fully electric vehicles.
2. Tools
3. Key Inputs and Outputs
3.1 Data Used
The simulation network topology is initially retrieved from OpenStreetMap (OSM) and adapted to accurately reflect real world infrastructure elements and characteristics. The accuracy of the road geometry was cross-validated with random sample comparison with further maps. Specifically, an adjustment was made at Evripidou and Pylis intersection where the junction has been recently replaced by a roundabout, but the OpenSteetMap database has not been updated accordingly yet. The variables of each road segment pertain to road geometric as well as functional characteristics, namely length, width, number of lanes, directions, and free flow speed. Moreover, the characteristics of the nodes that were included in the simulation network were the following: type of node, permitted movements, number of lanes per movement, priorities, and traffic signal plans. Traffic flow data were assumed based on similar data from previous studies for the same area such as the Trikala’s Sustainable Urban Mobility Plan (SUMP) and the AVINT project. The assumed data were used to synthesize an Origin-Destination (OD) Matrix. The existing bus lines which serve the test route were also simulated in SUMO, the schedules of the bus lines were retrieved from of the website of the public transport operator, and the bus stops’ locations were collected through Google Maps Street View. Existing traffic signs (e.g., yield or stop sign) were also taken into consideration while the traffic signal plans were automatically generated by SUMO. Moreover, SUMO’s tool “randomTrips.py” was used to generate person trips that encompass walking mode between random locations whereas SUMO’s tool “intermodal routing” was also used to define a trip of a person including mode changes. The parking area outside the Department of Physical Education and Sports Science was also simulated in SUMO. The number of parked cars and the parking duration were stochastically determined. Finally, the railway line was simulated in SUMO based on the actual train schedule.
3.2 Extracted KPI’s
TThe simulation analysis was carried out with the use of the microscopic traffic simulator SUMO which exports output that can be used for the estimation of multiple KPIs. In the context of the simulation analysis conducted for the Trikala pilot site the following KPIs were used to assess the impacts of automated shuttles on traffic efficiency:
Traffic Efficiency
- Average vehicle speed [km/h]
- Number of vehicles serviced during the simulation timeline [veh]
- Speed spatio-temporal diagrams [km/h]
- Average travel time of automated shuttles [sec]
- Trajectories of automated shuttles
4 Results
4.1 Impacts of Automated shuttles on traffic operations
Ten simulation runs pertaining to different random seed numbers have been executed for the aforementioned simulation scenarios. Moreover, traffic data are collected through simulated detectors that are placed at specific locations of the circular route at every 50 m. In the following, simulation results are analysed and discussed in terms of traffic efficiency. The reported simulation results encompass performance measurements such as the average vehicle speed and the average automated shuttle travel time, which are necessary for the quantitative assessment tasks in WP13.
The length of the fixed circular route is about 9.7 km and the average speed limit is 50 km/h except for the road segments belonging to school zones where the speed limit decreases to 30 km/h based on imposed traffic regulations. Figure 4 depicts the average vehicle speed for each simulated scenario variant (1-6) except for the baseline. According to Figure 4 the average vehicle speed observed in the three high-speed variants (variants 2, 4 and 6) is slightly higher than the observed speed of the low-speed variants (variants 1, 3 and 5). The lowest speed is observed in the low-speed scenario including ToC (variant 3) due to traffic disruption caused by ToCs and MRMs. On the other hand, in the case of green priority for automated shuttles at signalized intersections the figure depicts that speed is slightly higher for the high-speed scenario.
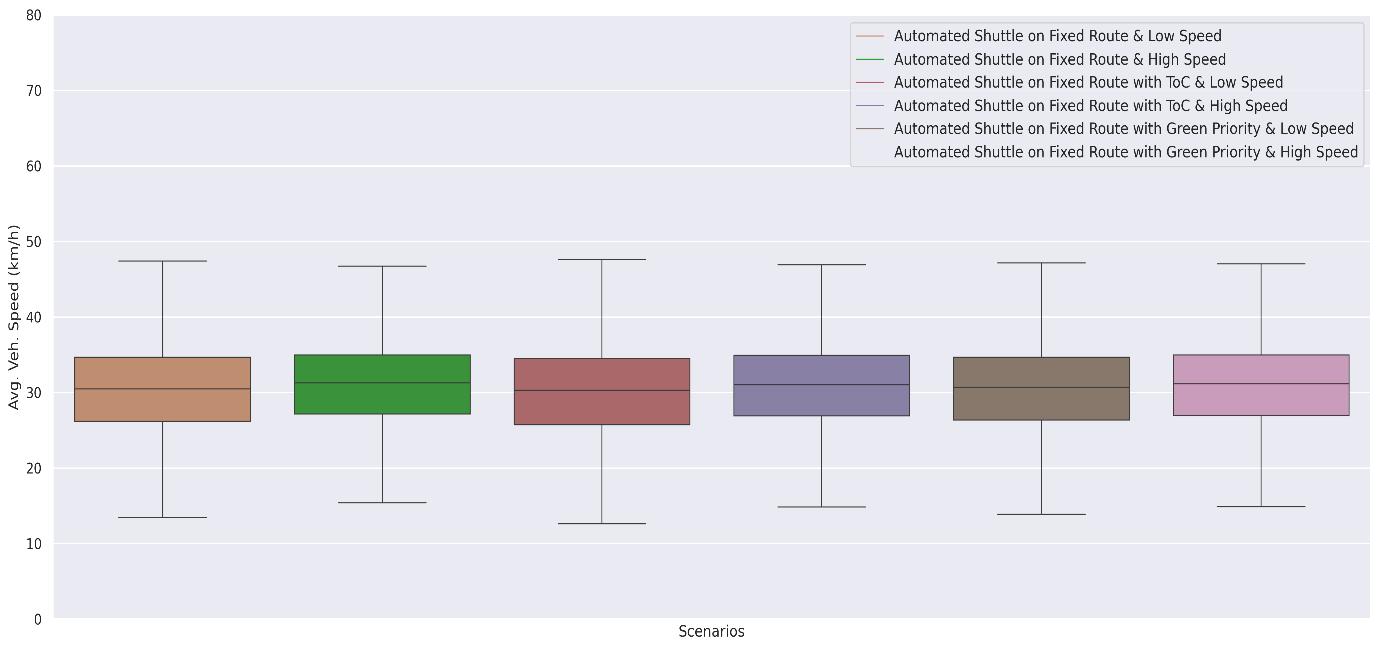
Figure 4: Average vehicle speed pes simulation scenario
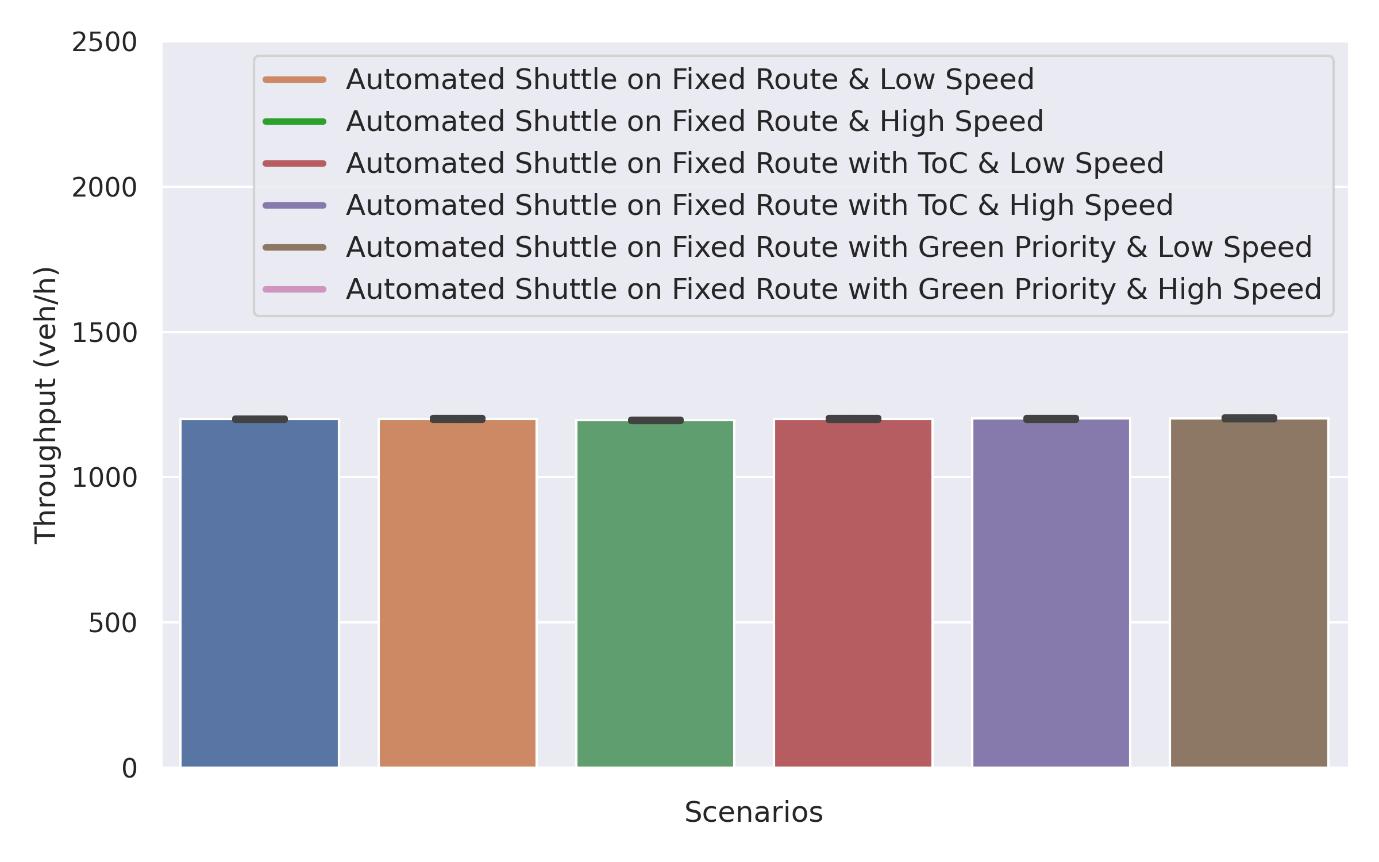
Figure 5: Throughput per simulation scenario.

Figure 6: Speed tempo spatial diagrams per simulation scenario variant.
Table 4 presents the required travel time for an automated shuttle to cross the predefined fixed route for each tested scenario. It is clear that green priority for automated shuttles reduces their travel time by approximately 8% whereas the green priority combined with high operational speed reduces the travel time of automated shuttles by 37%.
Scenario |
Scenario Variant |
Automated Shuttle = Travel time (sec) |
| Scenario 1 |
Variant 1 (Teleoperation + Low speed) |
1812 |
|
Variant 2 (Teleoperation + High speed)
|
1116 |
|
|
Variant 3 (AV mode + Low speed) |
1808 |
|
|
Variant 4 (AV mode + High speed) |
1276 |
|
|
Variant 5 (Variant 1 + Green priority)
|
1669 |
|
|
Variant 6 (Variant 2 + Green priority)
|
1140 |
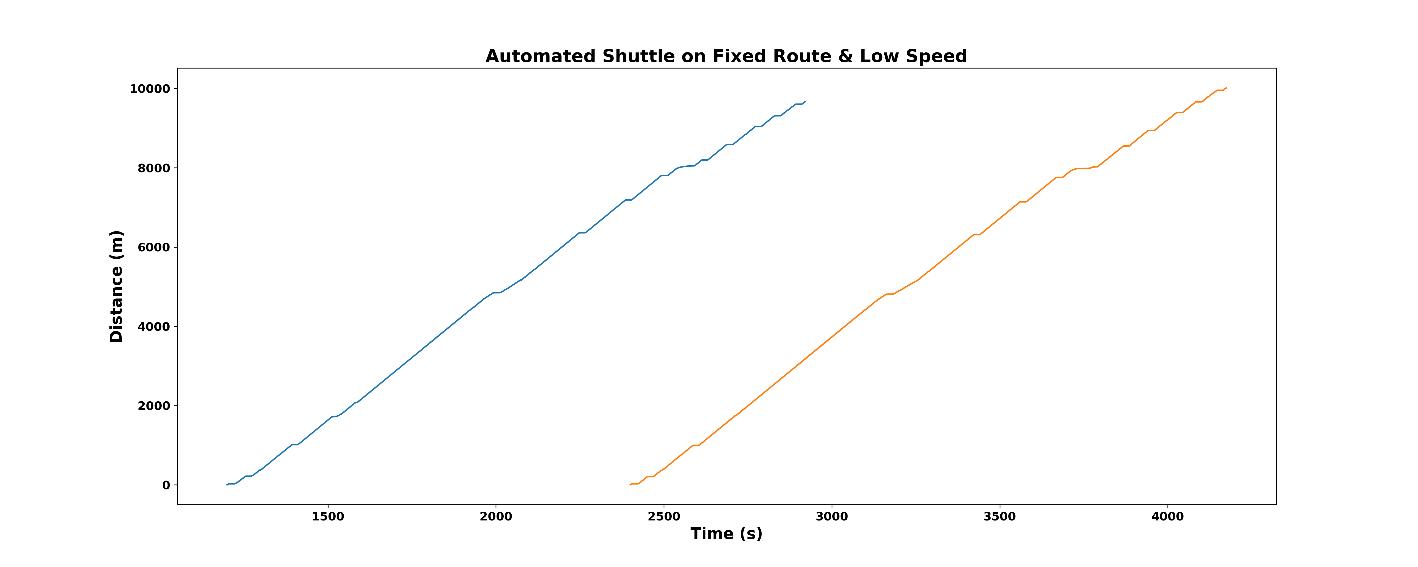
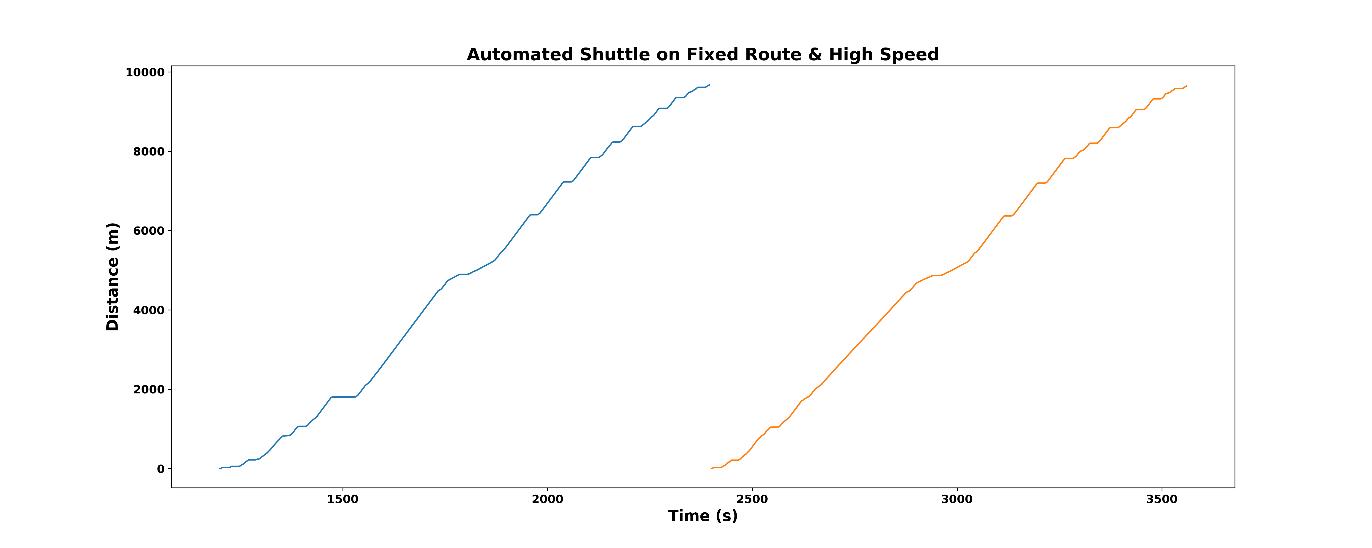
Figure 7: Trajectories of automated shuttles for scenario variants 1 (upper) and 2 (lower).
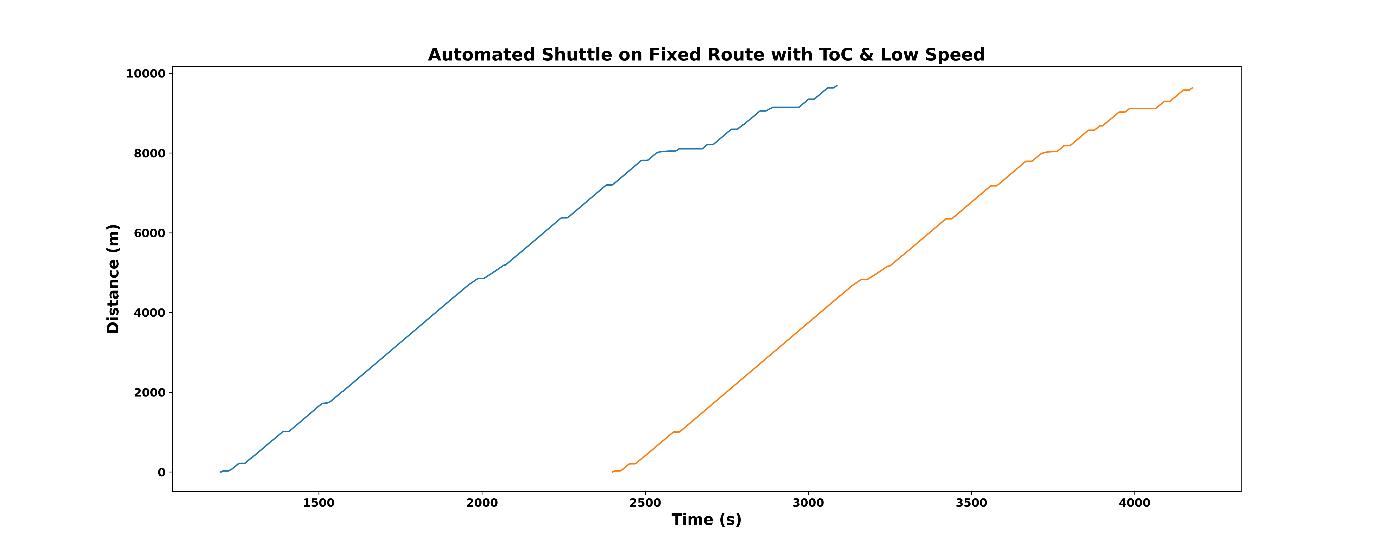
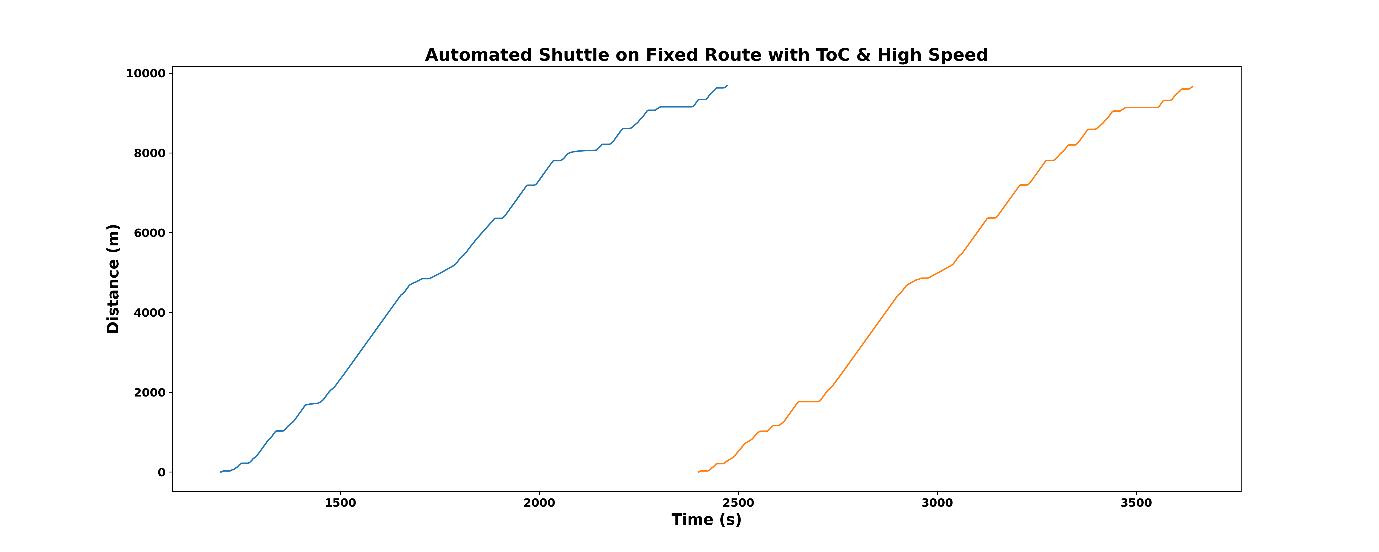
Figure 8: Trajectories of automated shuttles for scenario variants 3 (upper) and 4 (lower).
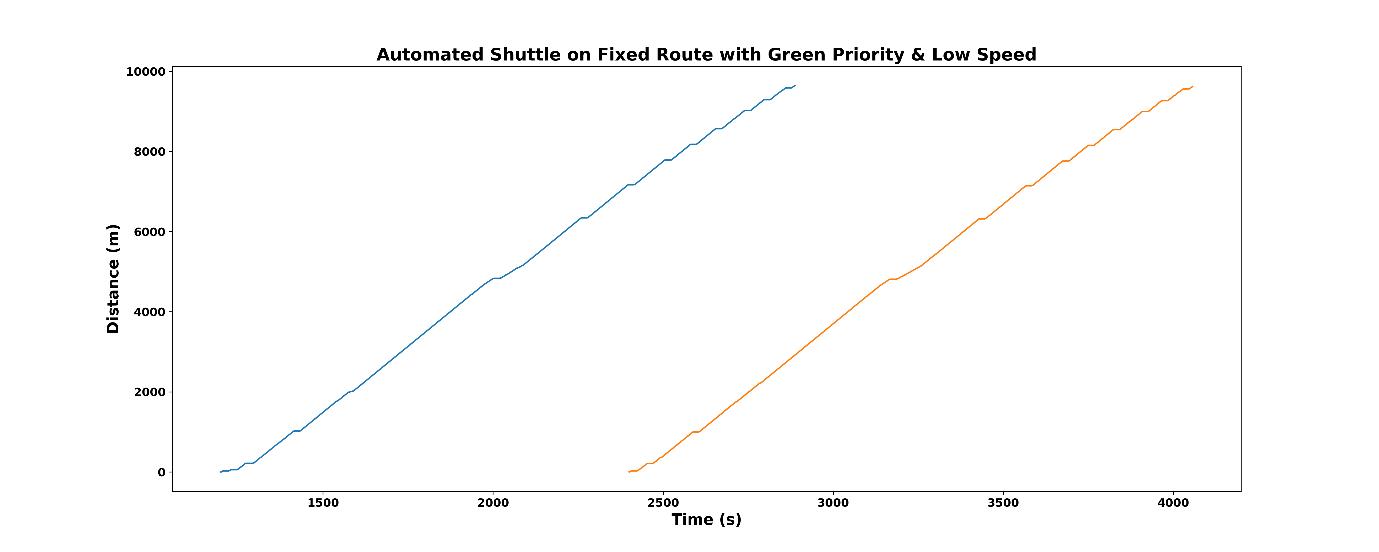
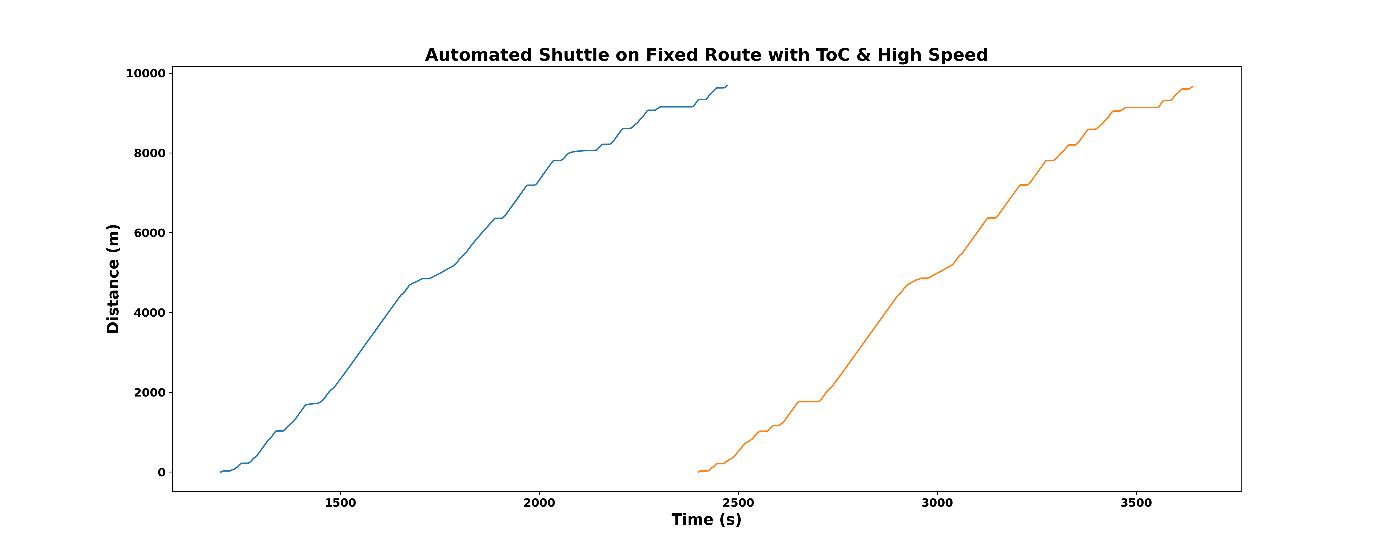
Figure 9: Trajectories of automated shuttles for scenario variants 5 (upper) and 6 (lower).
5 Strengths and Limitations
The conducted traffic microsimulation analysis exhibits several strengths:
- Traffic simulation, as a robust approach, enabled testing of new mobility technologies and examining the impacts of alternatives prior to real-life deployment such as the present case studies encompassing the introduction of automated shuttles.
- Traffic simulation also enabled modelling and analysis of complex traffic scenarios, such as investigating the ideal operating speed of the automated shuttles and the impacts of green priority at signalized intersections on traffic flow performance.
- The obtained results can guide stakeholders and practitioners with respect to the deployment of automated shuttles in real-world conditions at peri-urban road networks.
- Knowledge gained via the microsimulation analysis about critical factors that should be taken into account for the development of sustainable urban mobility solutions.
The conducted traffic microsimulation analysis exhibits several strengths:
- Since traffic microsimulation analysis was conducted, assumptions regarding automated driving modelling were necessary.
- Noteworthy simulation results were extracted from Trikala pilot site, nevertheless naturalistic driving data from the automated shuttles were not considered.
- Impacts of specific automated driving services were investigated while specific KPIs were obtained from simulations. Additional KPIs, apart from the examined ones, will be useful to shed light on additional impacts of automated driving services on traffic, safety and the environment that were not investigated yet.
- In the present simulation analysis, automated shuttles capable of specific operational speeds were simulated. Different parameters of automated shuttles (e.g. headway, acceleration and deceleration, etc.) should be investigated to enrich the impact assessment results.