MADRID
Simulating Automated Mobility
1 Scope
One of the pilot sites of the SHOW project is the Madrid mega site, which aims to enable and provide safe, sustainable and integrated people mobility. Specifically, the site concerns real (i) traffic shuttle service and (ii) bus depot operations. Specifically, the first investigation aimed to evaluate the impacts of various operational speeds for autonomous shuttle bus services on traffic safety using traffic microscopic simulation. A microscopic simulation analysis was performed for this reason in order to produce several measurements that quantified the effects of automated shuttle bus service under various traffic circumstances. In Villaverde, Madrid, many scenarios were created using the Aimsun Next mobility modelling program. The second investigation aimed to investigate the impacts of real-world automated driving vehicle operation in a bus depot concerning road safety, traffic and the environment using field data from the Madrid site. For this purpose, the microscopic simulation method was selected as well, in order to provide impacts that could not be measured in reality. The real-life highly automated vehicles operate in a bus depot placed in the Carabanchel district of Madrid, Spain, which further designed in the Aimsun Next mobility software.
1.1 Villaverde district site description
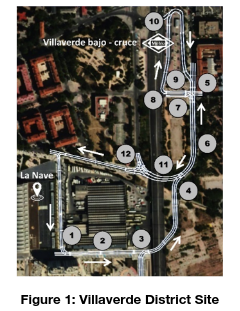
The aim of the Villaverde district site simulation is the implementation of an automated driving shuttle service route as is depicted in Figure 1. The service route is from point 1 – “Villaverde Bajo-Cruce” to point 10 – “La Nave”, which is a subway station. All the bus stations are fixed. The subway station (i.e., point 10) is the bus terminal, and it is surrounded by docks where the buses can park and wait until the departure time. However, routes’ frequencies are fully dependent on the charging periods of the bus batteries demand a stop of the service at certain moments of the day. With regards to bus specifications, the vehicle involved in this scenario will be a 12-meters automated driving electric bus (Irizar).
1.2 Carabanchel district site description
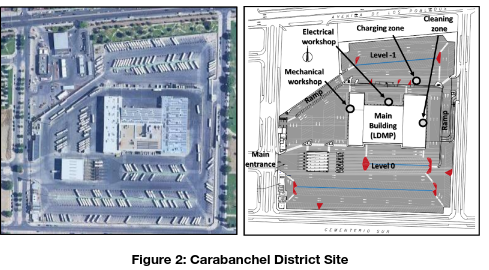
The Carabanchel simulation considers the Empresa Municipal de Transportes (EMT) depot operation as is shown in Figure 2. In the simulation model, trajectory data, provided by Tecnalia (TEC) and EMT, were considered for three types of automated vehicles: an AD electric mini bus (Gulliver), a 12-meter AD electric bus (Irizar) and an AD electric car (Renault Twizy) that will be leading buses from/to charging spots, in a platoon formation, avoiding any disruption of the normal operation into the premises.
1.3 Simulation network
1.3.1 Villaverde district simulation network
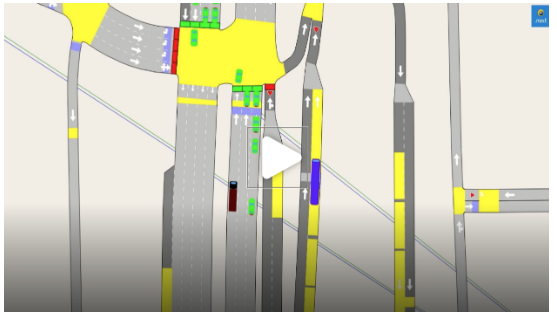
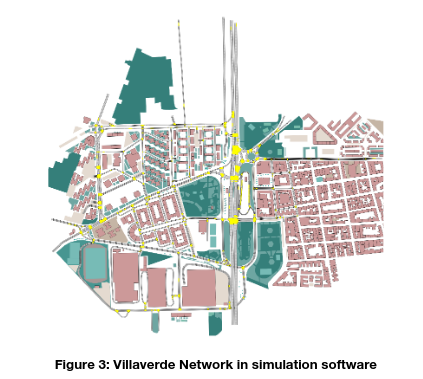
The study network of the Villaverde district site included a subpart of the Villaverde district in Madrid, Spain. The network contains the wider area of AV shuttle service route connecting La Nave with the subway station of Villaverde. The simulation network consists of 365 nodes and 668 road segments, as depicted in Figure 3. In addition, the total length of road sections is 23 km and the network size reaches approximately 2 km2. Furthermore, the examined Villaverde transport network includes at present 23 bus lines and 39 public transport stops, which were also included in the simulation model as well as frequencies and waiting times at stops, obtained from bus operator websites. The OD matrices that were utilised consist of 30 centroids, across the study network and the travel demand is 5,784 cars trips and 716 trucks trips within peak hour.
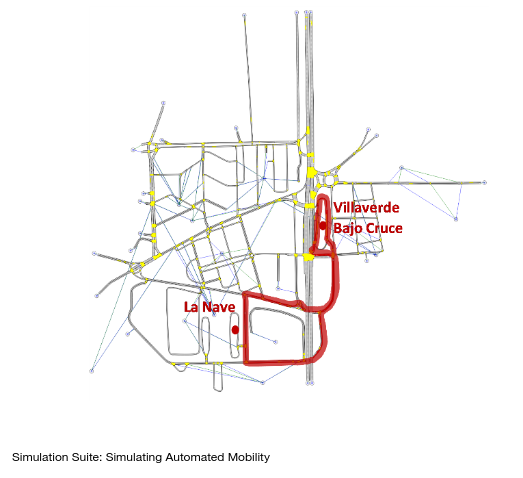
An automated shuttle bus service has been integrated into the simulation network, as seen in Figure 4. There is a single automated shuttle bus that runs at a fixed 15-minute interval; i.e., there are four departures every hour. There are two bus stops along the 1.6 km long service circular route. The shuttle bus is fully electric and runs in automated driving throughout the route. It has been constructed by Irizar and has a total capacity of around 58-61 passengers with a 25 seating capacity; its dimensions are 12 m in length and 2.55 m in width.
1.3.2 Carabanchel bus depot simulation network
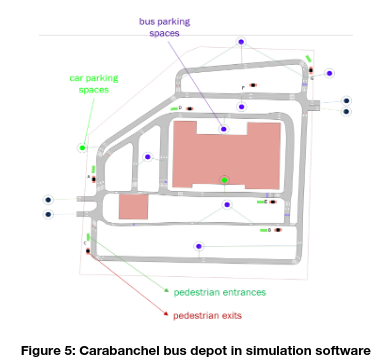
The examined bus depot of the Carabanchel site of the city of Madrid, Spain was designed in the simulation software as well. The simulated network, as shown in Figure 5, consists of 30 nodes and 40 sections. The prevailing movements are considered in the model: the vehicle OD matrices consisted of 11×11 centroids and a total number of 34 cars and 126 buses for a morning hour. The pedestrian OD matrix consists of 6 entrances and 7 exits and a total number of 211 pedestrians for a morning hour. Parking lots were simulated as centroids since the parking maneuver is not feasible in the simulation software and hence the effect on the network is the same due to the network calibration.
1.4 Simulation parameters
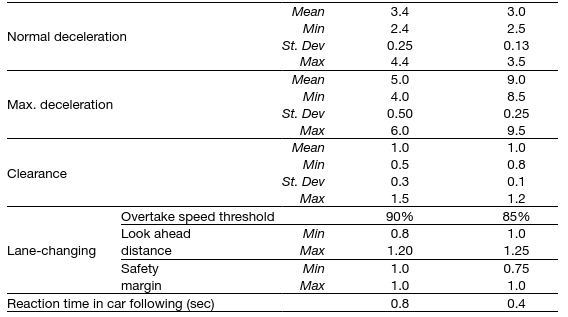
A driving profile was used for modelling connected autonomous vehicles providing advanced sensing and cognitive ability, data fusion usage, confident in taking decisions, small gaps, early anticipation of lane changes than human-driven vehicles, and less time in give way situations. In order for this to be succeed, parameters were used in the microsimulation procedure, which constitute findings derived from the LEVITATE Horizons 2020 project and were based on an extensive literature review and presented in a study by Mourtakos et al. [1]. All vehicle parameters are shown in Table 1.
Table 1: Microsimulation CAV parameters of LEVITATE project [1]

Moreover, all the autonomous vehicles that were simulated as well as the automated driving buses were assumed to be exclusively electric.
With regards to the automated driving services vehicles (namely, the vehicles that will be used in-situ), the parameters of each service vehicle were inserted into the simulation. Specifically, the Irizar shuttle bus dimensions were 12 m in length and 2.55 m in width and had a total capacity of 60 passengers with 25 passengers seating. Its maximum desired operating speed was 60 km/h, maximum acceleration 1.36 m/s2, maximum deceleration 10 m/s2 and weight 15,845 kg. Similarly, the Renault Twizy dimensions were 2.4 m in length and 1.4 m in width. Its maximum desired speed was 80 km/h, maximum acceleration 1.00 m/s2, maximum deceleration 1.00 m/s2 and weight 480kg + ~120kg. Additionally, the Gulliver mini-bus had a length of 5.32 m, and a width of 2.12 m. Regarding the maximum desired speed, is 32 km/h and weighs 3,000 kg. Its maximum acceleration was 2 m/s2, maximum deceleration was 6 m/s2 and the normal was 4 m/s2. Also, it had a total capacity of 25 passengers, including 7 passengers who are seated.
Subsequently, the simulation time step was set to 0.4 seconds since its value has to be multiple of the reaction time of the vehicles in the Aimsun software. The reaction time of the CAVs was considered 0.4 seconds based on the above CAV parameters and hence the simulation step was set to 0.4 seconds.
Finally, the Time-To-Collision (TTC) threshold value was considered as different in case of the connected and automated passenger cars due to their smaller standstill distance and was set to 0.5 seconds instead of 1.5 seconds (default value in the Safety Assessment Model software), based on the framework conducted in the LEVITATE Horizons 2020 research project [2].
1.5 Simulation scenarios
For the Villaverde site network, three sets of simulation scenarios have been investigated aiming in investigating the impact of an automated driving shuttle bus service operation: (i) various Connected and Automated Vehicle (CAV) market penetration rates (MPRs) within the current traffic demand (0%-100% increasing by 10%) applied to passenger cars and trucks, (ii) with or without the operation of the automated driving shuttle bus service, and (iii) different operational speeds for the automated driving shuttle bus service. Overall, the following scenarios for the operation of shuttle services were developed based on operational speed:
- Baseline (no automated driving shuttle bus operation)
- Automated driving shuttle bus service driving at 15 km/h operational speed
- Automated driving shuttle bus service driving at 30 km/h operational speed
- Automated driving shuttle bus service driving at 45 km/h operational speed
Different CAV MPR scenarios were also simulated for each of the aforementioned situations, ranging from 0% to 100% increasing by 10%. The introduction of CAVs specifically replaced the corresponding percentage of conventional vehicles. Traffic demand and characteristics were held constant throughout all shuttle service scenarios and MPRs for comparative analysis purposes. Since the primary goal of the current study is to look into different operational speeds for bus services, future traffic demand was not taken into account or forecasted. In total, 44 scenarios were simulated (11 MPR scenarios for each of the 4 shuttle service operation scenarios).
Additionally, 10 distinct replications of each scenario using random seeds (numbers used to initialize a pseudorandom number generator) were also simulated. Each scenario’s simulation lasted an hour during a peak hour. The automated shuttle bus service and the simulated CAVs were assumed to be fully electric. Furthermore, the change in CAV MPRs only applied to passenger cars and trucks; did not apply to public transportation buses, which continued to operate as usual in all of the scenarios considered.
For the Carabanchel bus depot network, four scenarios were considered in the simulations taking into account naturalistic data from the pilot operations of three automated vehicles. Three scenarios were created for each of the three automated driving vehicles operation (Gulliver, Irizar and Twizy) as well as a baseline scenario consisting of the existing network without the automated vehicle operations. The simulation time for all scenarios was 1 hour (morning peak hour). For the automation scenarios, only one route/round of each vehicle was completed during the 1 hour slot.
2 Tools
The microscopic simulation was conducted in the Aimsun Next mobility modelling software [3]. Aimsun Next is a proprietary software developed and owned by TSS-Transport Simulation Systems. It features a user-friendly interface, which allows users to create and manipulate models easily. The software also includes powerful visualization tools, including 3D models and animations, which help users understand the results of their simulations better. In the software, multiple impacts are able to be exported by modelling realistically traffic flows. Specifically, it is designed to help transportation professionals analyze and optimize the performance of transportation systems, including roads, transit systems, etc. In addition, Aimsun Next offers a range of features for transportation planning, including the ability to create detailed models of transportation networks, simulate traffic flow, evaluate different scenarios, and analyze the results. It can be used for a wide range of applications, such as testing new transportation infrastructure. Furthermore, the software utilizes advanced algorithms and models to simulate transportation systems accurately. It can model a range of different transportation modes, including cars, buses, trains, and pedestrians and can also provide traffic, environmental as well as road safety measurements at a high level of detail.
In order to assess safety impacts, the vehicle trajectories were also extracted from the microscopic simulation, and further analyzed using the Surrogate Safety Assessment Model (SSAM) software [4]. SSAM software is owned by the Federal Highway Administration (FHWA) and is available to download and use from the FHWA website. Specifically, SSAM is a software tool used to evaluate the safety performance of roadway designs and traffic control measures, based on surrogate measures of safety, which are used as proxies for actual crash outcomes. These measures include parameters such as vehicle speed, acceleration, and trajectory, which can be used to predict the likelihood of a crash occurring. By analyzing these surrogate measures, the SSAM software can help identify potential safety issues and evaluate different design options to optimize safety. The software processed the vehicle trajectory data given through the microscopic simulation and identified conflicts. A conflict is identified when the time-to-collision (TTC) and post-encroachment time (PET) are lower from preset thresholds, with 1.5 seconds and 5.0 seconds default values, respectively.
3 Key Inputs and Outputs
3.1 Data used
Initially, the geometry of the both study areas were exported from the OpenStreetMap digital map platform. The accuracy of the road geometry was cross-validated with random sample comparison with further maps. The variables for each road segment taken into account included road geometric as well as functional characteristics, namely length, width, number of lanes, directions, free flow speed and segment capacity. Also, the characteristics of nodes that were included in the model network were the following: allowed movements, number of lanes per movement, priority, traffic light control plans, free speed flow and capacity.
With regards to the Villaverde site, the microscopic model included volume data that were collected for the year 2018 from about 80 detectors. The necessary traffic data as well as AD shuttle bus features were provided by EMT de Madrid which is responsible for planning public urban transport in the city of Madrid, Spain. The detectors recorded traffic volume in vehicles per time. Those data were used in order to create the network travel demand. More specifically, a scenario was simulated and created the routes that will be followed and the respective OD matrices were extracted. The OD matrices consisted of 30 centroids, across the study network and the travel demand was 5,784 cars trips and 716 trucks trips within peak hour. The network was then calibrated according to the real traffic data.
Focusing on the Carabanchel site, TEC & EMT provided the trajectory data as extracted from all three SHOW automated vehicles (Gulliver, Irizar and Twizy) operation with the aim of inserting naturalistic data into the simulation model and several impacts to be extracted. Specifically, the moving buses, cars and pedestrians inside the parking depot within a timeframe were considered during the simulation network development. The naturalistic, real-traffic data were inserted in the simulation as follows: The AD vehicles route included 19 different sections in the Aimsun model. The main idea was to set a speed limit for each AD vehicle (Gulliver, Irizar and Twizy) for each of the 19 sections according to the provided field data in order to have the most realistic results possible. Based on vehicles trajectories, the real speeds of each vehicle (Gulliver, Irizar and Twizy), as well as the X and Y coordinates, were used in order to estimate the maximum speed for each section (per vehicle).
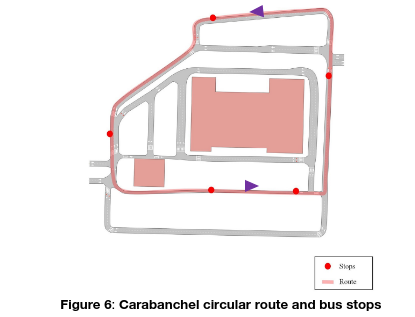
Also, from trajectory data, the bus stops were identified and located in the simulation model as well as the average waiting time, which was 14 seconds. The bus stops as well as the route can be found in Figure 6. Regardless, Twizy, being a light-weighted and nimble passenger vehicle drives the entire round without stops.
3.2 Extracted KPIs
The simulations were carried out in Aimsun Next software, which exports data that will enable to evaluate several KPIs. These KPIs can be classified into groups including “Road safety”, “Traffic efficiency,” and “Environment and energy efficiency” and other categories that cannot be extracted by the simulation tools. Multiple metrics assessing the impacts of CAVs in different traffic conditions were derived through the microscopic simulation. It should be mentioned that many additional detailed measurements can be extracted using the microsimulation model but only the most important are reported here. The definition of the plotted measurements along with the corresponding related KPI follow:
Road Safety
- Conflicts: the number of conflicts with other road users and infrastructure during the operation of the AV [count]
Traffic efficiency
- Delay Time: mean delay time [sec/km]
- Speed: mean speed [km/h]
- Total Distance Travelled: total distance travelled of the vehicles that exited the network [km]
- Travel Time: mean travel time [sec/km]
Environment and energy efficiency
- CO2 Emissions: total carbon dioxide emissions [g]
- NOx Emissions: total nitrogen oxides emissions [g]
- PM Emissions: total particulate matter emissions [g]
4 Followed Models
In modelling CAVs, their car-following and lane-changing behavior was considered different from human-driven vehicles behavior. Hence, the Gipps car-following [5] model and lane-changing model [6] were used, as they are included in the Aimsun Next software and are widely used in transportation engineering and traffic simulation software packages.
The Gipps car-following model is based on the assumption that drivers try to maintain a safe following distance from the vehicle in front of them while traveling at their desired speed. The model takes into account the driver’s reaction time, vehicle acceleration and deceleration, and the distance and speed of the lead vehicle to predict the speed and acceleration of the following vehicle. The Gipps lane-changing model, on the other hand, is a model that simulates the decision-making process that drivers use when changing lanes on a multi-lane roadway. The model takes into account the driver’s perception and reaction time, the speed and spacing of adjacent vehicles in the target lane, and the driver’s desired speed and position relative to other vehicles.
5 Results
5.1 Impacts of different automated driving shuttle bus service operations
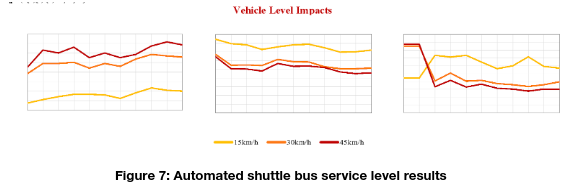
The automated shuttle bus service results on Irizar level are illustrated in Figure 7. By increasing the CAV MPR, Irizar mean speed was slightly increased, while travel time was decreased, as can be concluded by Figure 7. As would be expected, during 45 km/h operating speeds, a higher speed and shorter travel time was consistently recorded compared to other speed services across all MPR scenarios. In all three MPR conditions, the service operating at 15 km/h records disproportionately lower speed and higher travel time compared to other two speed services. When the shuttle bus travels at 45 or 30 km/h, the conflicts decrease in higher CAV MPRs, as opposed to 15 km/h, with the 45 km/h speed exhibiting the greatest decrease. This result could be explained by the fact that the higher operational speed shuttles adapt more to the average traffic speed, which makes them better synchronized with the traffic flow, especially at higher MPRs. This would prevent the higher-speed shuttle buses from having more risky interactions with other vehicles.
In addition, more measurements (i.e., automated shuttle service delay time, speed and travel time) are provided for the entire traffic within the network. Figure 8 and 9 show the network-level traffic and environmental measurements, such as delay time, speed, total distance travelled, and CO2, NOx, and PM10 traffic emissions, that were calculated using microscopic simulation.
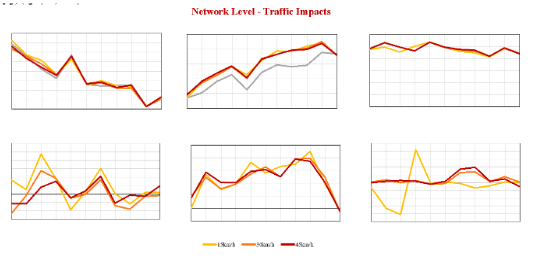
Figure 8: Network level traffic impacts of automated driving shuttle service operation
To summarise the general trend reflected in Figure 8, it can be stated that by increasing the CAV MPR, traffic conditions were improved overall. More specifically, distance travelled and delay time were reduced while speed was raised. Additional comparative plots were made in the second row of Figure 8 to compare the various operational speeds for the shuttle bus service with regards to the baseline scenario (without the operation of the Irizar AD shuttle service) because no significant variations between them on network level can be observed. It can be concluded that lower delay time was experienced with the higher operational speed services (30 and 45 km/h). The mean speed for all CAV MPRs displayed a similar trend, with a little increase indicated in comparison to the baseline situation. In addition, the majority of the MPR conditions had little effect on the overall distance travelled. Overall, it was shown that the three services’ effects stabilized at higher MPRs whereas the lowest operational speed service showed more fluctuations at lower MPRs compared to the other two services.
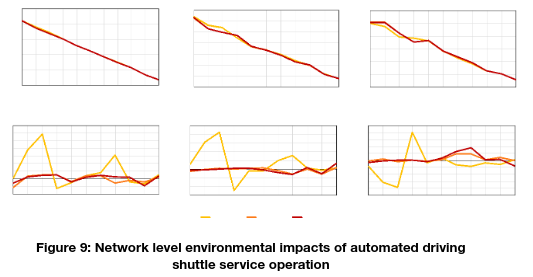
By examining the overall trend, it is possible to draw the conclusion that the electrification of the CAV fleet significantly improved the environmental conditions at network level. More particular, linear and considerable reductions in CO2, NOx, and PM emissions resulted from raising the MPR. Another general conclusion can be drawn from Figure 9, and specifically from the second row of comparative plots: The operational speed services of 30 km/h and 45 km/h were relatively consistent and close to the baseline across the MPR scenarios, while the operational speed service of 15 km/h fluctuated significantly below 70% MPR. Particularly, in lower MPRs (below 30%), the lowest operational speed service resulted in higher CO2 and NOx traffic emissions and lower PM emissions. The increase in CO2 and NOx corresponds with the respective increase in delays as shown in Figure 8. On the other hand, the PM levels for the respective CAV MPRs were lower due to the fact that fewer miles were driven as a result of higher traffic (Figure 8). Therefore, tire and brake wear, and vehicle-induced resuspension of road dust, which all cause PM emissions, were lower. For greater MPRs, no appreciable differences between the different services were found.
5.2 Impacts of automated driving in a bus depot operation
The results of the bus depot simulations were grouped in three groups of plots i.e. Vehicle Level, Network Level and Pedestrian Level, as follows in Figure 10.
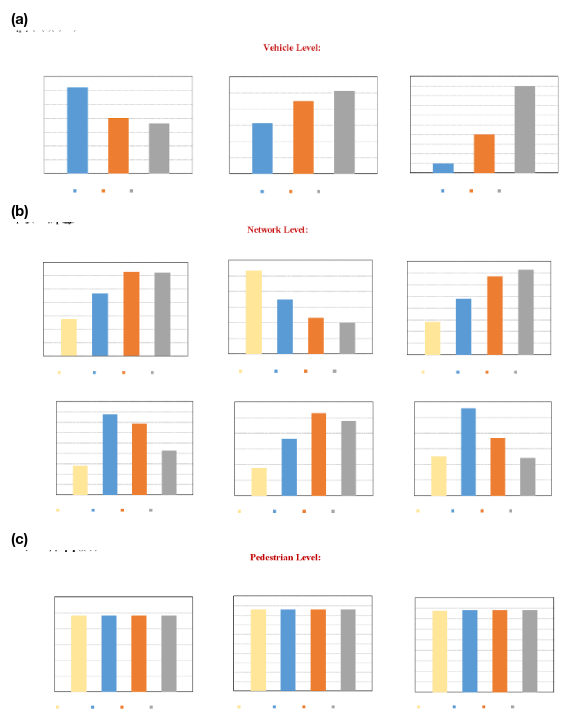
Figure 10: Impacts of automated vehicle operations in bus depot on (a) vehicle level, (b) network level and (c) pedestrian level.
Considering the extracted values from the microsimulation in Figure 10, the Twizy vehicle seems to have a higher speed throughout the entire route since it is a light-weighted passenger vehicle compared to the heavier, more cumbersome buses. The speed trend is also reflected to travel time, meaning that with lower speeds, higher travel times are recorded. Additionally, conflicts in which the SHOW vehicles were involved seem to have the exact opposite trend compared to speed. This can be attributed to the fact that a vehicle operating with a higher speed records a shorter trip duration with lower interactions with other vehicles inside the bus depot.
With regards to the network level, and more specifically traffic impacts, all three vehicles seem to increase network delay time and travel time as well as decrease network speeds since all SHOW vehicles are slower than the manually driven vehicles that coexist in the network. Moreover, the SHOW vehicles were an addition to the normal (baseline) traffic of the parking depot. The trends of the aforementioned measurements follow the opposite trend of speed as expected. With regards to the environmental impacts, all three vehicles seem to increase environmental emissions more than the current baseline conditions. Finally, on the pedestrian level, pedestrian speed, stopping time and travel time seems to remain unaffected by the operations of the different vehicles, probably due to the fact that there were several crossings in the depot. Moreover, for each scenario, vehicle-level results (i.e., the trajectory of the SHOW vehicles) for each vehicle were subsequently extracted.
6 Strength and Limitations
The conducted traffic microsimulation research provided several strengths:
- Traffic simulation, as a robust approach, enabled testing of new mobility technologies and examining the impacts of alternatives before real-life interventions such as the present case studies including the introduction of automated driving services.
- Traffic simulation also enabled modelling and analysis of .complex traffic scenarios, such as investigating the ideal operating speed of an automated shuttle bus service and study its impacts on traffic flow and safety.
- The followed methodology enabled the simulation of scenarios including naturalistic driving data of automated driving vehicles and the examination of their interactions with human-driven vehicles as well as with pedestrians in the bus depot case study.
- The obtained results could guide stakeholders and practitioners as the examined scenarios included fundamental aspects for future conditions, such as automated private and public transport vehicle operations.
- Findings can also aid to accelerate the development and deployment of autonomous vehicles and to improve their safety and reliability on the roads.
- From the knowledge gained from the microsimulation, insights could be derived for critical factors that should be taken into account for the development of sustainable urban mobility.
On the contrary, the present research does have certain limitations:
- Since traffic microsimulation was employed, assumptions regarding automated driving modelling were unavoidable.
- Noteworthy results were extracted from both sites, nevertheless the simulation of Villaverde district did not include naturalistic driving data of the automated driving shuttles as well as did not consider pedestrian traffic, while in the Carabanchel simulations, field and pedestrian traffic data were included.
- Impacts of specific automated driving services were investigated while specific KPIs were obtained from simulations. Additional KPIs, apart from the examined ones, will be useful to shed light on further impacts of automated driving services operation on traffic, safety and the environment that were not investigated yet.
- In the present simulations, testing services with specific operational speeds were explored. Hence different speeds, apart from the examined ones, as well as different parameters of autonomous shuttle buses (e.g. headway, acceleration and deceleration, etc.) should be investigated to enrich the impact assessment of automated transport systems.
7 Conclusions
“The results revealed that a higher operational speed of an automated shuttle service operates more efficiently overall for lower market penetration rates of autonomous vehicles, while operational speed seems to not impact traffic and environmental conditions in higher market penetration rates.”
“The operation of automated driving vehicles increases bus depot delay time and travel time, while it decreases average speed due to the fact that autonomous vehicles tend to operate at reduced speeds in comparison to manually driven vehicles that coexist in the bus depot.”
References
- Mourtakos, V., Oikonomou, M.G., Kopelias, P., Vlahogianni, E.I., Yannis, G., 2021. Impacts of autonomous on-demand mobility service: A simulation experiment in the City of Athens. Transp. Lett., 1–13. https://doi.org/10.1080/19427867.2021.2000571
- Chaudhry, A., Sha, H., Haouari, R., Quddus, M., Thomas, P., Boghani, H., Weigermars, W., Gebhard, S., Singh, M.K., Morris, A., 2022. Evaluating the Network-Level Road Safety Impacts of Connected and Automated Vehicles in Mixed Traffic Using Traffic Microsimulation Methods. Transp. Res. Board 101st Annu. Meet. Washingt. DC, United States, 2022-1-9 to 2022-1-13.
- TSS-Transport Simulation Systems. (2019). Aimsun Next (Version 22) [Computer software]. TSS-Transport Simulation Systems. https://www.aimsun.com/aimsun-next/
- Pu, L., Joshi, R., 2008. Surrogate Safety Assessment Model (SSAM): Software User Manual. https://www.fhwa.dot.gov/publications/research/safety/08050/08050.pdf
- Gipps, P.G., 1981. A behavioural car-following model for computer simulation. Transport. Res. Part B 15 (2), 105–111. https://doi.org/10.1016/0191-2615(81)90037-0
- Gipps, P.G., 1986. A model for the structure of lane-changing decisions. Transport. Res. Part B 20 (5), 403–414. https://doi.org/10.1016/0191-2615(86)90012-3
