GRAZ
Simulating Automated Mobility

1 Scope
This document deals with the simulation activities related to the Graz Pilot Site. More precisely, street level simulations and in particular pedestrian simulations are presented.
1.1 Pilot description
The test site Graz has some challenging urban environments with bus stops and pedestrians, busses, and public traffic. A shopping mall and several independent stores are the surrounding of the test environment. The key objectives of the Graz site are the following:
• Integrate automated and connected shuttles into existing mobility services
• Enable automated vehicles to enter highly frequented public transport bus stops
• Perform safe detection of pedestrians and shuttle passengers at bus stops
• Construction of an automated shuttle line demonstrator linked to a bus stop Our shuttle service, provided for SHOW project, connects the public transport hub Puntigam with the shopping center West. This testing environment (see Figure 1) is basically split in three major parts: (i) the train-, bus- and tram-stop (shown on the right), (ii) the bus-lane leading to the shopping center West and (iii) the roads within the shopping center (on the left side). Every section has its own challenges. The transport hub is served by six public bus lines, a tram line and it is also connected to an urban railway station (cp. Figure 2) and a small park-and-ride facility is also located in the immediate vicinity of the transport hub. Thus, many pedestrians roam around the area and cross the road in a very unstructured manner.
The bus-lane connecting the transport hub with the shopping center is a restricted road section – only public busses are allowed to use it. Sporadically pedestrians walk on this road although they actually have a separate walkway. In the third section consists of a rather complex traffic layout within the shopping center with many lanes, curves and roundabouts and also high traffic volumes, especially during shopping hours. The speed limit for driving is 30 km/h in those areas as the city of Graz has a general speed limit of 30 km/h excluding priority roads. An exception is the bus terminal, where a self-defined maximum speed of 10 km/h was chosen due to safety reasons and the larger number of pedestrians. On the whole route, the automated vehicle can encounter pedestrians and buses
An essential task of the automated journey is to drive through the bus terminal. Here, it must be determined which bus bay is available, i.e. free of buses, and where few VRUs are at risk. For this reason, the bus terminal digital infrastructure must allow to detect presence of buses and acquire information of buses arriving soon. The bus terminal is monitored via a smart camera system. It detects the bounding boxes of the objects in its view, classifies them and provides corresponding information locally to the C-ITS Road Side Unit (RSU), which further sends out C-ITS messages to the vehicles. In addition, AVs need to cross a tram track after leaving and before entering the bus terminal. This information is also conveyed via C-ITS to the vehicles.
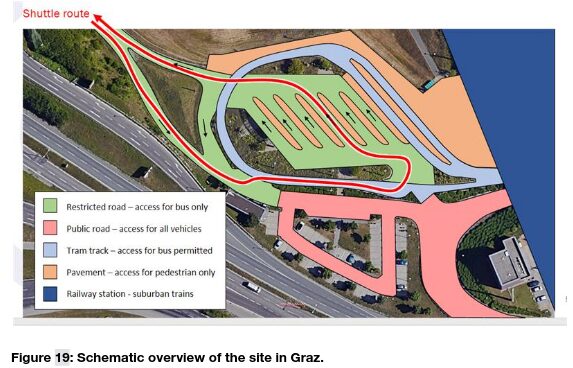
The site in Graz, considered for the simulation experiments, is a public transport hub where several bus lines and 2 tram lines meet at a railway station (see Figure 19). The automated vehicle (AV) will serve as a shuttle between the hub and a nearby located shopping mall. The route, on which the vehicle will operate, is marked by a red line in the figure. The (in the figure marked) green area is closed for individual car traffic and is used by pedestrians changing from bus to tram or from bus to train and vice versa. On their way, most of the pedestrians are crossing the shuttle route which will lead to potential conflicts. This setting has been chosen for six scenarios, where the behaviors of the pedestrians are simulated and the impacts on the operation of the automated vehicle are evaluated.

1.2 Simulation Network
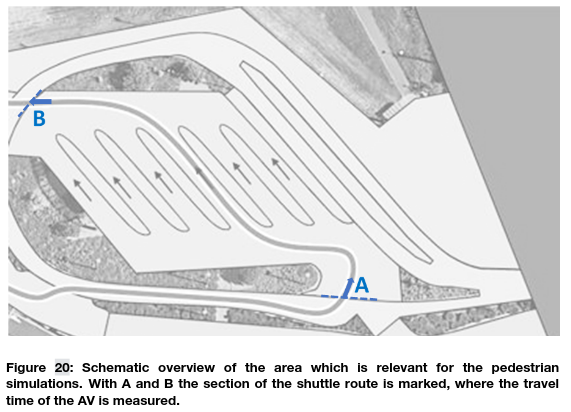
Figure 20 shows that part of the area in detail which has been taken for the simulation scenarios. The automated shuttle departs from bus platform 3 every five minutes and for the evaluation of the scenarios the travel time between point A and B is measured. The time when the vehicle stops at the platform for passenger exchange is excluded.

1.3 Simulation scenarios
Additionally, the percentages of time when the vehicle has to slow down significantly or even has to stop because of crossing pedestrians are calculated. The occurrence and the movement of the pedestrians are generated according to a fictive timetable of arriving and departing railway trains, trams and busses. For the simulation of the pedestrian’s behavior an extended Social Force Model [11] is used. Here, the movement of a pedestrian and her interaction with other individuals (including the AV) is represented by a set of attractive and repulsive forces. The model extension refers to the behavior when pedestrians approach the automated vehicle. An additional parameter has been introduced which influences the weight of the repulsive force coming from the AV. Thereby, two modes have been implemented:
1) Well behaved: Pedestrians of this type take care about the automated vehicle. When the vehicle approaches, they stop in time, so that the vehicle can move on.
2) Rowdie: Pedestrians of this type don’t care about the automated vehicle, contrary, they suppose that it will stop anyway. By varying the proportion of “well behaved” pedestrians relative to “rowdies” in 20%-steps, six scenarios have been defined: 1) 100% Rowdies, 2) 20% well behaved, 3) 40% well behaved, 4) 60% well behaved, 5) 80% well behaved and 6) 100% well behaved.
For the simulation of the AV, a rudimentary model was used which moves the vehicle along a given path with a desired speed and which brakes or stops if pedestrians get too close. The modelling of the acceleration processes is simplified, as well and does not correspond to the real vehicle which will be in use at this site. Since, we are not interested in the real movement behavior of the AV at this point, this simple model is sufficient to answer the questions concerning the pedestrian-AV interactions.
2 Tools
The simulations were carried out in the proprietary AIT tool Simulate. This was chosen, since it allows the free movement of pedestrians within open space rather than relying on defined lanes for pedestrians. Since the transport hub in Puntigam is quite complex, the restrictions of movement of pedestrians would have restricted the scenarios too much since people tend to move freely between transit stops.
The tool is based on a social force approach for simulating interaction of pedestrians with each other and with the automated vehicles.
3 Key Inputs and Outputs
3.1 Data used
An exact map of the study area was used to feed the tool.
3.2 Extracted KPIs
Several KPIs were calculated from the simulation results. The KPIs are mainly about the feasibility or running an automated shuttle through a busy PT hub without a breakdown of operations of the automated vehicle due to risk averse strategies in interaction of automated vehicles with vulnerable road users.
- Speed per vehicle type
- Average vehicle delay of automated shuttle
4 Followed Models
The model used for the shuttle just consists of a stopping model, that stops the shuttle when it has a conflict with a pedestrian. For the pedestrians a social force model is applied for interactions with other pedestrians.
5 Results
The results of the pedestrian simulations (see Table 1) show that only, a cooperative behavior of all pedestrians significantly reduces the travel time of the AV. Already one “rowdie” in a group forces the AV to react. An increasing percentage of “well behaved” pedestrians shifts the percentage of “stopped” towards “slow” but has no significant positive effect on the travel times.
Table 1: Simulation results.
| Scenario | travel time [s] | Percentage of travel time when the AV stopped | Percentage of travel time when the AV slowed down |
| 100% Rowdies | 53 | 40% | 29% |
| 20% well behaved | 55 | 36% | 38% |
| 40% well behaved | 51 | 35% | 33% |
| 60% well behaved | 54 | 31% | 31% |
| 80% well behaved | 50 | 24% | 41% |
| 100% well behaved | 36 | 8% | 45% |
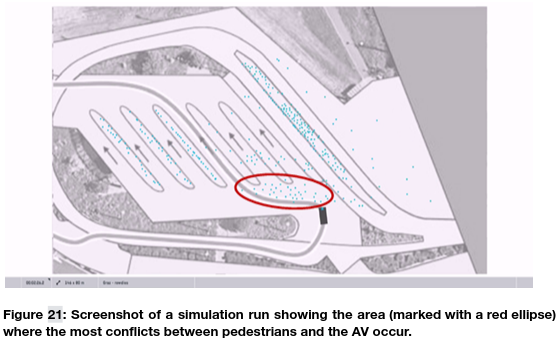
The simulations have pointed out two improvement measures to reduce the negative impacts on the operation of the shuttle. First, Re-directing of the pedestrians: The shortest path from the bus platforms to the entrance of the train station runs along the shuttle route in front of the platforms 2 and 3 (see Figure 21).

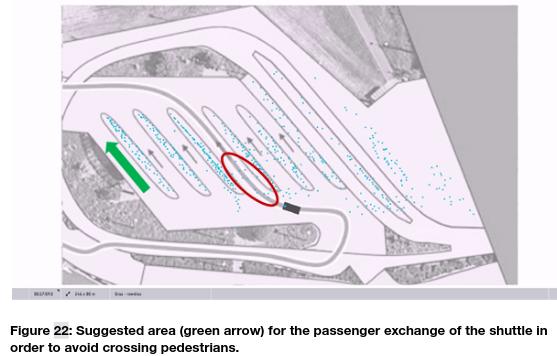
This creates a large area where conflicts between pedestrians and the automated vehicle potentially occur. If it is possible to reroute the pedestrians (e.g. by signage or pavement markings) in such a way that they cross the shuttle route only in a small area between the platforms, the situation could be improved significantly. Additionally, Relocation of the shuttle route: If the point where the shuttle stops for passenger exchange is moved to the most western platform (platform 6, see Figure 22), the shuttle will be able to operate almost free of conflicts with pedestrians.

6 Strengths and Limitations
The usage of proprietary microscopic simulation Simulate has several strengths:
- Easy free movement of pedestrians is possible and easy to implement.
- Interaction between different road users are modelled with easy
On the contrary, the present research does have certain limitations:
- There is no direct coupling of automated vehicle functions from the ViF Simulations with the pedestrian models of AIT.
7 Conclusions
The strength of the Simulate pedestrian simulation is that it enables free movement of the pedestrians in space, not limiting them to predefined sidewalks and pedestrian crossings. In addition, interfaces to ROS are set up enabling a link to vehicle models.
A weekness is that there currently are only very simple models to integrate motorized transport into the simulation. This could be solved by coupling it with other tools like SUMO.
References
Helbing, D. and Johansson, A. (2009): “Pedestrian, Crowd and Evacuation Dynamics”, in book “Encyclopedia of Complexity and Systems Science”, Springer New York.