TRIKALA
Simulation Transferability
1 Mathamatical Definitions
The behavior of the automated shuttles in the microscopic traffic simulation model of the Trikala pilot site was dictated by an Adaptive Cruise Control (ACC) model that handled car-following episodes and a Transition of Control (ToC) model that handled control transitions between manual and automated driving modes. Comprehensive descriptions of the latter models along with their corresponding mathematical formulations are provided below.
1.1 Adaptive Cruise Control (ACC) Model
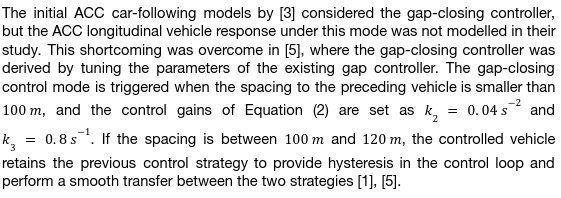
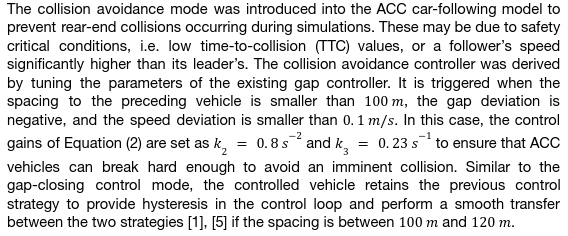
The ACC driving model is based on [1], [2], [3], [4], [5], whereby the developed control law in the ACC control algorithm is explicitly divided into three modes based on three different motion purposes: (i) speed (or cruising) control, (ii) gap-closing control, and (iii) gap control. More specifically, the speed control mode is designed to maintain the chosen desired speed by the driver, the gap control mode aims to maintain a constant time gap between the controlled vehicle and its predecessor, while the gap-closing controller enables the smooth transition from speed control mode to gap control mode. In addition, TransAID has introduced a fourth mode (i.e. collision avoidance mode) to the latter controller that prevents rear-end collisions when safety critical conditions prevail. In the following text we present the basic definitions and equations for these four ACC control modes.
Speed Control Mode
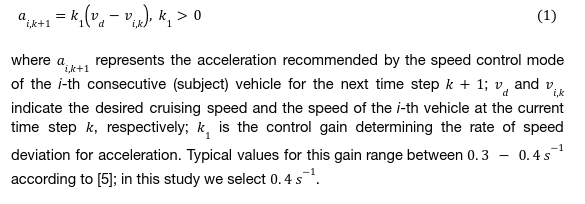
The feedback control law in speed mode is activated when there are no preceding vehicles in the range covered by the sensors, or preceding vehicles exist in a spacing larger of 120 m [1], [5]. This mode aims to eliminate the deviation between the vehicle speed and the desired speed and is given as:
Gap Control Mode
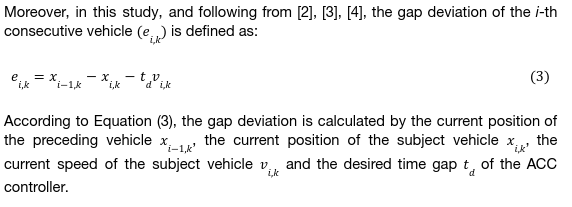
When the gap control mode is activated, the acceleration in the next time step k + 1 is modelled as a second-order transfer function based on the gap and speed deviations with respect to the preceding vehicle; it is defined as:


Gap-closing Control Mode
Collision Avoidance Mode
1.2 Transition of Control (ToC) Model
ToCs in (C)AVs can be classified according to several characteristics [6], [7]. The class of passive, downward transitions is likely to be the most critical as these pose high demands on a potentially distracted human driver in terms of time constraints for the take-over.
For simulative studies on the impact of cumulative occurrences of ToCs in TAs, simulation models need to be developed, being capable of reproducing the important processes during such events. Figure 1 shows a schematic representation of the presumed phases during a downward ToC [8].

From a modelling perspective it is clear that the time point of switching between automated and manual driving mode requires a careful handling as the model features a discontinuity here. For the implementation, the car-following and lane-change models of the simulated driver-vehicle-unit (DVU) are substituted at this moment, and it must be ensured that this does not introduce unnaturally high brake rates or similar artefacts.
For the assessment of the impacts of ToCs on traffic safety and efficiency, the choice of parameters of the automated and manual mode is crucial. Especially the phase of reduced driving performance may be conjectured to imply an adverse effect due to irregular or erroneous behaviour, which disturbs a smooth traffic flow. Considerable evidence has been presented to claim that measures of driving performance may drop when a take-over is requested with an insufficient lead time [9], [10], [6]. Mostly, the available studies are concerned with Level 3 automation and urgency ToCs and aim at estimating the lead time that permits drivers to operate their vehicle safely after performing the ToC. In general, this lead time was found to be significantly longer if the driver disengages from the driving process, i.e., more distracted or out of the loop for a longer period of time [10], [11], [12]. This observation is especially important for the case of highly automated vehicles since the driver is likely to engage in other activities, which distract further from the driving process. Indicators, which were used to quantify the driving performance and are directly related to the driving process, are for instance speed variation / throttle input [9], [13], lane keeping [13], [14], braking precision / overbraking [11], [13], [15], and the type of evasive manoeuvre applied in case of an urgent ToC [9]. But also, indirect indicators of attentiveness and situation awareness were studied, e.g. the driver’s ability to reconstruct a depicted situation after looking at it for different amounts of time [16], and the frequency and type of glances and eye movements [17], [18], [19].
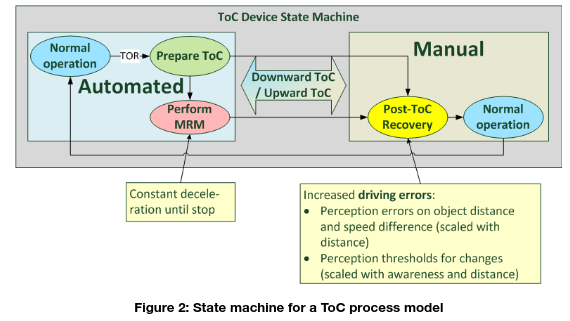
Figure 2 shows a diagram for a model capturing the essential phases and transition during the ToC process. Both driving modes, automated and manual, have a state of normal operation, which corresponds to a normal driver performance for the manual mode and undisrupted functioning for the automated mode. After a take-over request (ToR) has been issued, the model for automated control enters the “Prepare ToC” state, where it resides until the driver responds to the ToR, or until the lead time has elapsed, in case of which it initiates a Minimum Risk Manoeuvre (MRM). The entry point to the manual mode is the “Post-ToC Recovery” period during which a decreased driver performance is assumed.
Parametrisation of the ToC Model
The ToR can be communicated to the driver with a relatively long lead time until the ToC is required to be executed. This means, that the transitions to be modelled are not urgent but planned. Unfortunately, the research body on planned ToCs is rather scarce in comparison to urgent ToCs [6], which received the greatest attention so far because they are likely to lead to the most critical situations.
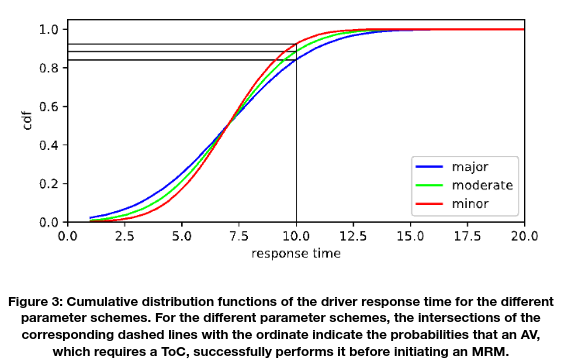
For the lead time a value of 10 seconds is fixed, which has to be interpreted in conjunction with the distribution of driver response times. This distribution was modified between the different parameter schemes to affect the probability of an MRM being initiated, which presumably represents the largest impact of ToC processes on the traffic flow. Figure 3 shows the cumulative distribution functions for the different parameter schemes. These are truncated normal distributions with a mean of 7 seconds and variances of 2.1 (minor impact), 2.5 (moderate impact), and 3.0 (major impact). This results in the following probabilities for MRMs:
- Minor impact: P(MRM) = ~7.7%,
- Moderate impact: P(MRM) = ~11.6%
- Major impact: P(MRM) = ~16.2%
Note that a simulated Driver-Vehicle Unit (DVU) is assumed to switch immediately to the manual mode after the response time has elapsed, even if this requires an abort of an ongoing MRM. Therefore, not only the occurrence of an MRM is an important quantity but also its duration, which is the difference of the response time and the lead time. Thus, the most MRMs occurring in the simulations are of short duration (>85 % lie within 0-3 s and >97.5 % within 0-5 s for all parameter schemes) and are interrupted before the vehicle comes to a full stop.
Other important parameters are the initial awareness distribution affecting the driver state at the moment of performing the ToC, and the various coefficients for the driver state model error and perception mechanisms.
Modelling of a Decreased Post-ToC Driver Performance
The observations of increasing performance measures with increasing take over time can be attributed to an underlying recovery process of the driver’s awareness and the mental capacity available for the driving process [16], [20], [21], [22].
As this recovery process can be assumed to exhibit a high variability between different drivers and situations, it seems unavoidable that the level of disengagement will be elevated at least for some drivers of automated vehicles after the ToC, even if the granted lead time assures that a good performance can be expected after the ToC for most events.

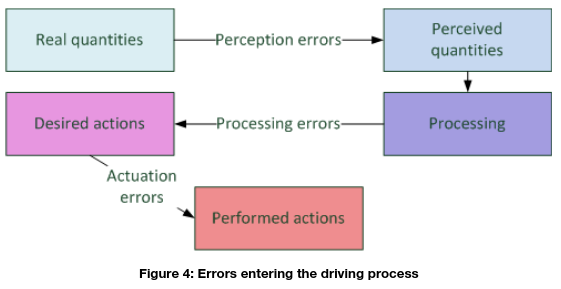
For the period, where the awareness is reduced, i.e., At<1, an increased error rate is assumed for the leading DVU. Although errors may enter the driving process at several stages (Figure 4), the modelling is restricted to one source, which is chosen to be the accuracy of the driver’s perceptions, i.e. the perception errors. This simplification is followed since it is not obvious how a more detailed error mechanism would to lead to a significant improvement of the model with respect to the modelling purposes, because no driver error source specific countermeasures are developed here.
Perception errors may be introduced to a car-following model in a generic way. A given model is assumed to be of the form:
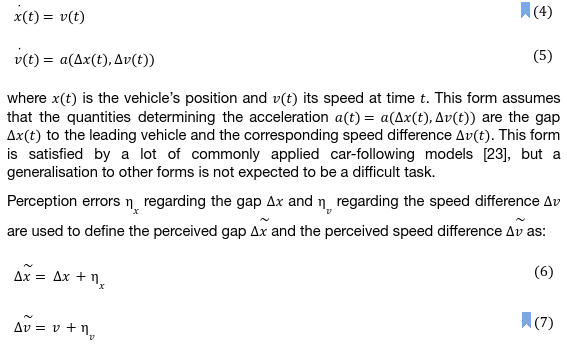
The erroneous driving behaviour is then described by the equations:

Both errors are derived from a scalar Ornstein-Uhlenbeck process Η with time-dependent noise intensity t and time scale t. The process H evolves according to:

The effective errors x and v are assumed to be proportional to the distance to the leading vehicle [24] and the main error term Ηt, that is:

with constant coefficients cx and cv. The time scale and the noise drive of Η follow the temporal changes of the awareness A(t) as follows:

Roughly speaking, this implies that the higher the awareness, the faster any errors decay and the smaller is their range.
As an additional generic mechanism for imperfect driving, perception specific action points were considered [24], [25]. An action point is an instant t where the acceleration a(t) is changing its value according to the dynamical equation of the given car-following model.
A change in a perceived quantity is only recognised if its magnitude surpasses a certain threshold value. Accordingly, a corresponding change in action, here, a change of acceleration, is only taken out when the currently perceived speed difference vt deviates sufficiently from the last recognised value vrec or the currently perceived gap xt deviates from the value estimated based on the last recognised quantities. That is, instant t is assumed an action point if either:

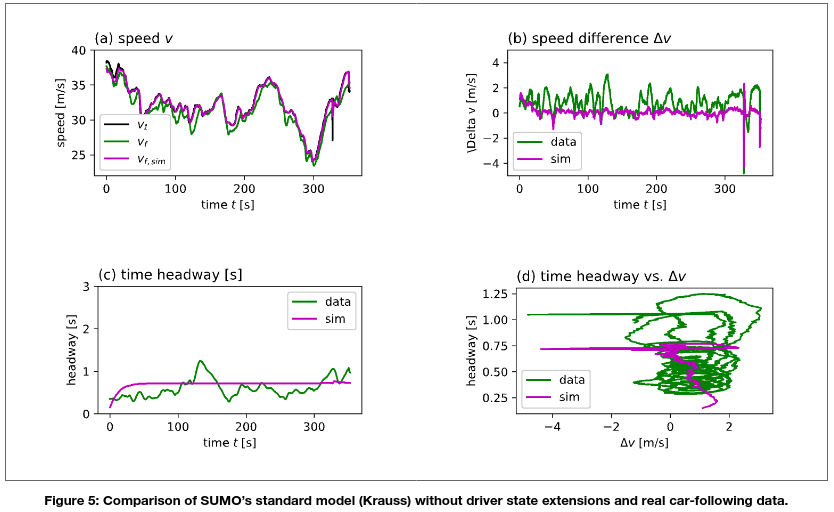
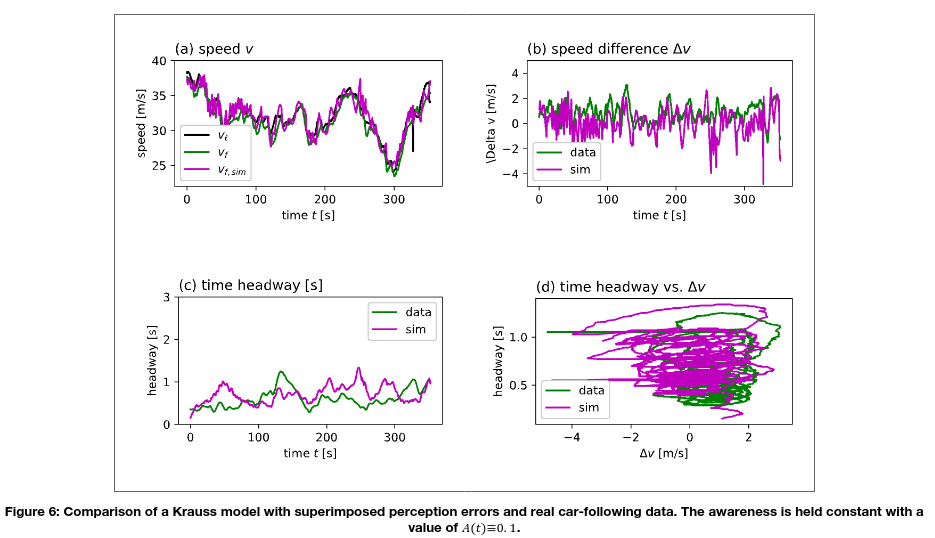
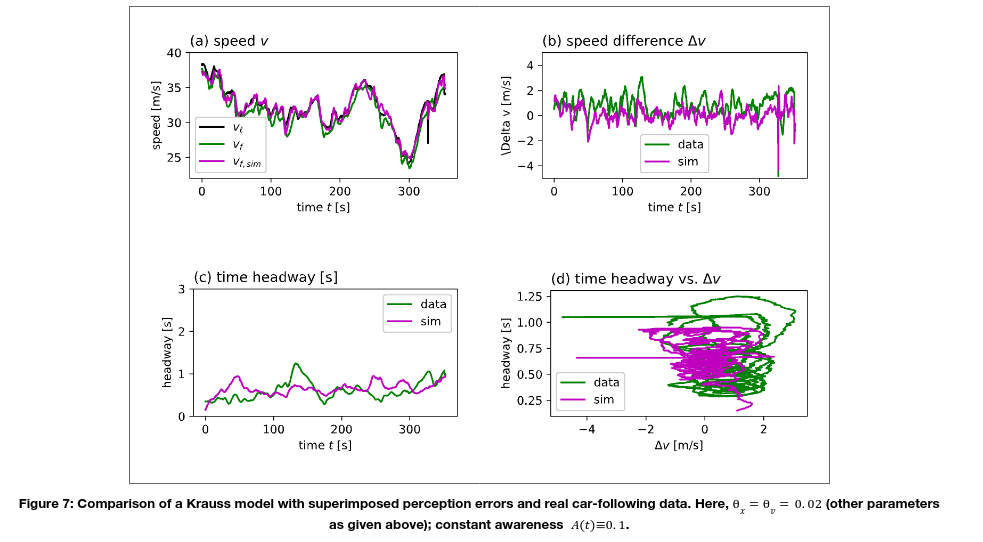
Figures 5-7 compare data generated by SUMO’s standard model, the proposed model and data from a real car-following episode of an approximate duration of 5.5 min. This episode was extracted from the simTD database.
The experimental setup entailed a simulated car-following situation, where a simulated, model-controlled following vehicle drove behind a simulated vehicle following exactly the recorded speed profile of the real leading vehicle. Figure 5 shows the trajectory obtained from a Krauss model (the standard SUMO model), and Figures 6-7 show trajectories of the model extended by the perception error mechanism as described above for two different parametrisations.
If not stated otherwise, the following parameter values were used for the driver state model of the following vehicle:

2 Parameterization
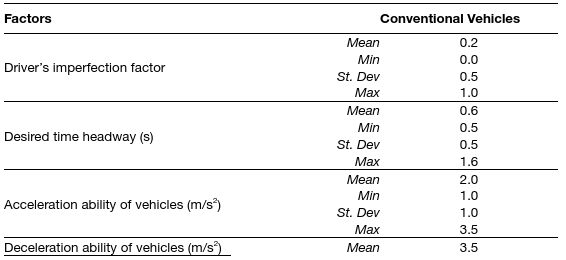
Table 1 depicts the parametrization of the latter models according to findings from the H2020 TransAID project [26], [27], [28] and the requirements of the simulation scenarios. One the other hand, the simulated behavior of conventional vehicles was determined according to the default car-following and lane changing models of the microscopic traffic simulator SUMO (i.e. Krauss car-following model, LC2013 lane change model). Table 2 depicts the selected parametrization of the default models.
Table 1: Parametrization of car-following and ToC models for automated shuttles per simulation scenario
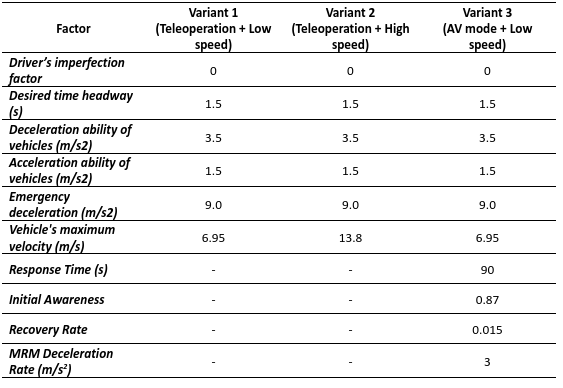
Table 2: Parametrization of car-following and lane change models for conventional vehicles

3 Transferability
For the present use case only microscopic simulations were conducted. Therefore, the application of an up-scaling methodology is necessary in order to conduct any transferability analysis of the results or any generalization with some degree of success. These types of methodologies are described in the following.
Up-scaling from micro to macro simulation using PCUs
A methodology of up-scaling automated driving simulation outputs was conducted by Tympakianaki et al. [29] and used in the LEVITATE EU project [30]. In this methodology, the impacts of CAVs were assessed with respect to network performance. In Figure 8, the considered steps of the up-scaling method are illustrated.
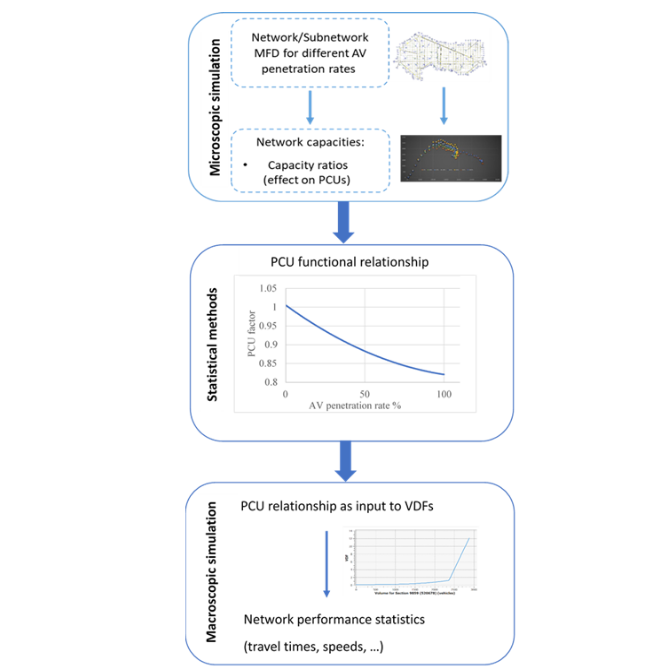
Figure 8: Aimsun upscaling approach by Tympakianaki et al. (2022) [29].
The considered steps of the up-scaling method are explained:
- Firstly, the network capacity should be derived through the microscopic simulation. By network capacity we define the maximum number of vehicles exiting the simulation network between simulation time intervals (e.g. 2 minutes). A suitable and easily transferable approach for observing the network capacities is through the Macroscopic Fundamental Diagram (MFD). The MFD is the basis of traffic flow theory and demonstrates a functional relationship between the network characteristics, i.e., traffic flow (throughput), vehicle density and speed.
- The second step includes a statistical analysis that identifies the effects on the Passenger Car Units (PCUs) as a relative change of capacities. Based on the microscopic simulation results, a fitted function (i.e. linear, polynomial, etc.) can be used to derive the PCUs given the capacities obtained from the network MFD. The PCUs are derived by the capacity ratio of conventional vehicles (CV) and AVs using the following formula:
- The last step is to provide the PCU relationship as an input to the Volume Delay Functions (VDFs) of macroscopic models to forecast the potential macroscopic implications on the network performance. The VDFs are functions that model travel time among different parameters such as volume and capacity. For this reason, the macroscopic models apply VDFs in order for travel time values to be calculated. VDFs represent the relationship between flows and delays of each road segment. A function defining travel time was developed by US Bureau Public Roads [31] and is the following:
where tff is the free-flow travel time, v/c is the volume-to-capacity ratio, and a, b two adjustable parameters.
This methodological approach is essential as the small-scale simulated networks would be up-scaled to city-level networks. In addition, the transferability of the simulation outputs to other networks or/and regions would be applicable. If a microscopic simulation model of a city is not available, the generalized PCU functional relationship estimated from a different network could be used as input into a travel demand model to forecast the macroscopic impacts. Furthermore, more robust simulations with validated automated driving parameters (limiting the assumptions related to the used parameters) could be executed and consequently, more concrete results could be extracted.
This methodology requires the combination of micro with macro simulations. The main benefit of this methodology is that the results of microscopic simulation can be evaluated if they are significantly similar to those derived from macroscopic simulation (essentially to be up-scaled) in order to see if they can be generalized as well as if they are transferable to different regions or cities. Therefore, the fundamental outcomes expected via the application this methodology are up-scaled results to city-level network and transferable simulation outputs to other networks/regions.
Up-scaling from micro to macro simulation using extensions of driver models and additional MFD specifications
Building upon the PCU method and recent advances in the literature with regards to traffic flow theory and AVs, the MFD could be further exploited for upscaling processes. One alternative is proposed by [32], where an MFD for AV traffic flows is proposed along with macroscopic and microscopic measurement proposals. For example, using vehicle travel time and distance travelled inside a simulation area, an MFD can be created and up-scaled in the macro scale, in order to be fitted into a macroscopic simulation. Furthermore, recently developed models such as the cell transmission model (CTM) by [33], headway modelling as described in [34] and the Flexible Traffic Stream Model (FTSM) by [35], that have been shown to be easily transferrable from the micro to the macro scale could be used to obtain MFDs using the methodology described in Lu et al. [36]. In [36], an MFD is drawn based on measurements from SUMO inputs and a macroscopic speed-density function is obtained through a Generalised Additive Model (GAM) regression for specific AV penetration rates.
As it can be understood, apart from network capacity and the PCU method, even with limited AV trajectories [32] or with the exploitation of headways [35] and speeds of vehicles [36] the transferability of microscopic simulation outputs can be achieved through the construction of MFDs to the macroscopic level and further impact assessment results can be obtained.
References
- Liu, H., Kan, X., Wei, D., Chou, F.-C., Shladover, S. E., Lu, X.-Y., 2018. Using Cooperative Adaptive Cruise Control (CACC) to Form High-Performance Vehicle Streams—Microscopic Traffic Modeling. FHWA Exploratory Advanced Research Program No. Cooperative Agreement No. DTFH61-13-H-00013. University of California, Berkeley: California PATH Program.
- Milanés, V., Shladover, S. E., 2014. Modeling cooperative and autonomous adaptive cruise control dynamic responses using experimental data. Transportation Research Part C: Emerging Technologies, 48, 285–300. https://doi.org/10.1016/j.trc.2014.09.001
- Milanés, V., Shladover, S. E., 2016. Handling Cut-In Vehicles in Strings of Cooperative Adaptive Cruise Control Vehicles. Journal of Intelligent Transportation Systems, 20(2), 178–191. https://doi.org/10.1080/15472450.2015.1016023
- Milanes, V., Shladover, S. E., Spring, J., Nowakowski, C., Kawazoe, H., Nakamura, M., 2014. Cooperative Adaptive Cruise Control in Real Traffic Situations. IEEE Transactions on Intelligent Transportation Systems, 15(1), 296–305. https://doi.org/10.1109/TITS.2013.2278494
- Xiao, Lin, Wang, M., van Arem, B., 2017. Realistic Car-Following Models for Microscopic Simulation of Adaptive and Cooperative Adaptive Cruise Control Vehicles. Transportation Research Record: Journal of the Transportation Research Board, 2623, 1–9. https://doi.org/10.3141/2623-01
- Eriksson, A., Stanton, N. A., 2017. Takeover Time in Highly Automated Vehicles: Noncritical Transitions to and From Manual Control. Human Factors: The Journal of the Human Factors and Ergonomics Society, 59(4), 689–705. https://doi.org/10.1177/0018720816685832
- Lu, Z., Happee, R., Cabrall, C. D. D., Kyriakidis, M., de Winter, J. C. F., 2016. Human factors of transitions in automated driving: A general framework and literature survey. Transportation Research Part F: Traffic Psychology and Behaviour, 43, 183–198. https://doi.org/10.1016/j.trf.2016.10.007
- Gold, C., Damböck, D., Lorenz, L., Bengler, K., 2013. “Take over!” How long does it take to get the driver back into the loop? Proceedings of the Human Factors and Ergonomics Society Annual Meeting, 57(1), 1938–1942. https://doi.org/10.1177/1541931213571433
- Blommer, M., Curry, R., Swaminathan, R., Tijerina, L., Talamonti, W., Kochhar, D., 2017. Driver brake vs. Steer response to sudden forward collision scenario in manual and automated driving modes. Transportation Research Part F: Traffic Psychology and Behaviour, 45, 93–101. https://doi.org/10.1016/j.trf.2016.11.006
- de Winter, J. C. F., Happee, R., Martens, M. H., Stanton, N. A., 2014. Effects of adaptive cruise control and highly automated driving on workload and situation awareness: A review of the empirical evidence. Transportation Research Part F: Traffic Psychology and Behaviour, 27, 196–217. https://doi.org/10.1016/j.trf.2014.06.016
- Louw, T., Kountouriotis, G., Carsten, O., Merat, N., 2015. Driver Inattention During Vehicle Automation: How Does Driver Engagement Affect Resumption of Control? 4th International Conference on Driver Distraction and Inattention (DDI2015). Presented at the Sydney. Retrieved from http://eprints.whiterose.ac.uk/91858/
- Merat, N., Jamson, A. H., Lai, F. C. H., Carsten, O., 2012. Highly Automated Driving, Secondary Task Performance, and Driver State. Human Factors: The Journal of the Human Factors and Ergonomics Society, 54(5), 762–771. https://doi.org/10.1177/0018720812442087
- Clark, H., Feng, J., 2017. Age differences in the takeover of vehicle control and engagement in non-driving-related activities in simulated driving with conditional automation. Accident Analysis & Prevention, 106, 468–479. https://doi.org/10.1016/j.aap.2016.08.027
- Mok, B., Johns, M., Miller, D., Ju, W., 2017. Tunneled In: Drivers with Active Secondary Tasks Need More Time to Transition from Automation. Proceedings of the 2017 CHI Conference on Human Factors in Computing Systems, 2840–2844. https://doi.org/10.1145/3025453.3025713
- Young, M. S., Stanton, N. A., 2007. Back to the future: Brake reaction times for manual and automated vehicles. Ergonomics, 50(1), 46–58. https://doi.org/10.1080/00140130600980789
- Lu, Z., Coster, X., de Winter, J., 2017. How much time do drivers need to obtain situation awareness? A laboratory-based study of automated driving. Applied Ergonomics, 60, 293–304. https://doi.org/10.1016/j.apergo.2016.12.003
- Samuel, S., Borowsky, A., Zilberstein, S., Fisher, D. L., 2016. Minimum Time to Situation Awareness in Scenarios Involving Transfer of Control from an Automated Driving Suite. Transportation Research Record: Journal of the Transportation Research Board, 2602, 115–120. https://doi.org/10.3141/2602-14
- Zeeb, K., Buchner, A., Schrauf, M., 2015. What determines the take-over time? An integrated model approach of driver take-over after automated driving. Accident Analysis & Prevention, 78, 212–221. https://doi.org/10.1016/j.aap.2015.02.023
- Ziegler, J., Bender, P., Schreiber, M., Lategahn, H., Strauss, T., Stiller, C., … Zeeb, E., 2014. Making Bertha Drive-An Autonomous Journey on a Historic Route. IEEE Intelligent Transportation Systems Magazine, 6(2), 8–20. https://doi.org/10.1109/MITS.2014.2306552
- Fuller, R., 2005. Towards a general theory of driver behaviour. Accident Analysis & Prevention, 37(3), 461–472. https://doi.org/10.1016/j.aap.2004.11.003
- Merat, N., Jamson, A. H., Lai, F. C. H., Daly, M., Carsten, O. M. J., 2014. Transition to manual: Driver behaviour when resuming control from a highly automated vehicle. Transportation Research Part F: Traffic Psychology and Behaviour, 27, 274–282. https://doi.org/10.1016/j.trf.2014.09.005
- Young, M. S., Stanton, N. A., 2002. Malleable Attentional Resources Theory: A New Explanation for the Effects of Mental Underload on Performance. Human Factors: The Journal of the Human Factors and Ergonomics Society, 44(3), 365–375. https://doi.org/10.1518/0018720024497709
- Treiber, M., Kesting, A., 2013. Traffic Flow Dynamics: Data, Models and Simulation. Retrieved from //www.springer.com/us/book/9783642324598
- Xin, W., Hourdos, J., Michalopoulos, P., Davis, G., 2008. The Less-Than-Perfect Driver: A Model of Collision-Inclusive Car-Following Behavior. Transportation Research Record: Journal of the Transportation Research Board, 2088, 126–137. https://doi.org/10.3141/2088-14
- Todosiev, E. P., 1963. The action point model of the driver-vehicle system (Ph.D. Thesis). The Ohio State University.
- Lücken, L., Mintsis, E., Kallirroi, N. P., Alms, R., Flötteröd, Y. P., Koutras, D., 2019. From Automated to Manual – Modeling Control Transitions with SUMO. EPiC Series in Computing, Vol. 62, pp 124-144.
- Mintsis, E., Lücken, L., Karagounis, V., Porfyri, K., Rondinone, M., Correa, A., Schindler, J., Mitsakis, E., 2020. Joint deployment of infrastructure-assisted traffic management and cooperative driving around work zones. In 2020 IEEE 23rd International Conference on Intelligent Transportation Systems (ITSC) (pp. 1-8). IEEE.
- Alms, R., Noulis, A., Mintsis, E., Lücken, L., Wagner, P., (2022). Reinforcement Learning-Based Traffic Control: Mitigating the Adverse Impacts of Control Transitions. IEEE Open Journal of Intelligent Transportation Systems, 3, 187-198.
- Tympakianaki, A., L. Nogues, J. Casas, M. Brackstone, M. G. Oikonomou, E. I. Vlahogianni, T. Djukic, and G. Yannis (2022). Autonomous Vehicles in Urban Networks: A Simulation-Based Assessment. Transportation Research Record, 03611981221090507. https://doi.org/10.1177/03611981221090507.
- LEVITATE EU. (2022). The LEVITATE EU project. Retrieved September 27, 2022, from https://levitate-project.eu/downloads/
- United States Bureau of Public Roads. (1964). Traffic Assignment Manual for Application With a Large, High Speed Computer. US Department of Commerce, Bureau of Public Roads, Office of Planning, Urban Planning Division, Washington, D.C.
- Shi, X., and X. Li. (2021) Constructing a Fundamental Diagram for Traffic Flow with Automated Vehicles: Methodology and Demonstration. Transportation Research Part B: Methodological, Vol. 150, pp. 279–292. https://doi.org/10.1016/j.trb.2021.06.011.
- Adacher, L., and M. Tiriolo (2018). A Macroscopic Model with the Advantages of Microscopic Model: A Review of Cell Transmission Model’s Extensions for Urban Traffic Networks. Simulation Modelling Practice and Theory, Vol. 86, pp. 102–119. https://doi.org/10.1016/j.simpat.2018.05.003.
- Li, L., and X. (Michael) Chen (2017). Vehicle Headway Modeling and Its Inferences in Macroscopic/Microscopic Traffic Flow Theory: A Survey. Transportation Research Part C: Emerging Technologies, Vol. 76, pp. 170–188. https://doi.org/10.1016/j.trc.2017.01.007.
- Zheng, L., Z. He, and T. He (2017). A Flexible Traffic Stream Model and Its Three Representations of Traffic Flow. Transportation Research Part C: Emerging Technologies, Vol. 75, 2017, pp. 136–167. https://doi.org/10.1016/j.trc.2016.12.006.
Lu, Q., T. Tettamanti, D. Hörcher, and I. Varga (2020). The Impact of Autonomous Vehicles on Urban Traffic Network Capacity: An Experimental Analysis by Microscopic Traffic Simulation. Transportation Letters, Vol. 12, No. 8, pp. 540–549. https://doi.org/10.1080/19427867.2019.1662561.