

The SHOW project aims to advance sustainable urban transport through the introduction of automated vehicles (AVs). Within the project, many different operators, OEM’s, local authorities, and technology providers work together to deploy AVs across Europe and integrate them into public transport networks.
Because of the variety of actors involved, a unified approach from all project pilot sites on how to monitor fleets and vehicles is needed. By consolidating different approaches, the SHOW Dashboard has been conceived to provide a unified view of all SHOW pilot sites in terms of performance monitoring and visualisation of real-time vehicle information. It enables access to various data (e.g., route, stops, speed of vehicles, batterie level of charge), to optimise operations, and get an insight of the impacts of the fleet operation on e.g. the environment or on the traffic flow. The SHOW Dashboard will be dynamically updated, with more data coming up per SHOW pilot site and for more pilot sites joining the field trials.
More precisely, static and dynamic data about the site and the vehicles are communicated to the SHOW Dashboard:
- Site data: Geographical locations, properties of the site
- Vehicle data:
- Static: Vehicle identity, cargo and passenger capacity, environmental footprint (fuel type and consumption), and manufacturer’s specification, etc.
- Dynamic (i.e., received during the operation): position, operation driving modes, trip, number of passengers, etc
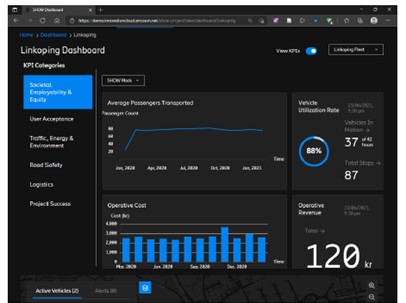
Figure 1: SHOW Dashboard site view (KPI screen)
This data is compiled under the SHOW data management platform to be visualised in SHOW Dashboard. The Key Performance Indicators (KPI) are calculated in order to assess the success of each demonstration, in terms of e.g.:
- Road Safety: Road conflicts (Events/km, Accidents/km)
- Traffic: Mileages (km travelled), Average speed (Km/h)
- Energy: Energy consumption (kWh/km)
- Environment: Emission, Noise level (CO2-equivalent g/km, dB(A))
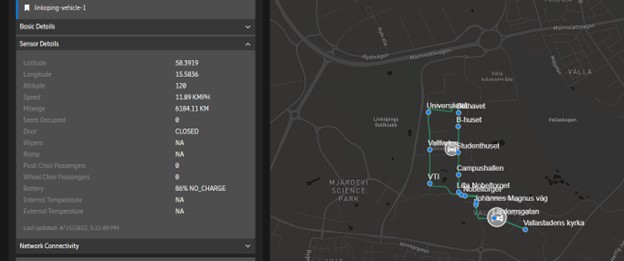
Figure 2: SHOW Dashboard’s real-time fleet monitoring at a SHOW pilot site
The SHOW Dashboard has been built on the Ericsson Innovation Cloud, an innovation IoT (Internet of Things) platform of the Swedish strategic innovation program “DriveSweden” for future sustainable mobility solutions and it is linked with the SHOW reference architecture (cf. article on the system architecture of SHOW here).
Beyond the SHOW members, an information panel of the SHOW Dashboard with data available to the public will be made accessible for all. Curious to have a look?
Access the public SHOW DashboardFor more information on the SHOW Dashboard, you can contact Thanh Hai Bui from RISE (thanh.bui [at] ri.se) or Stig Persson from Ericsson (stig.persson [at] ericsson.com).